Commercial property valuation explained for practitioners, covering income, sales comparison, and cost approaches, data sources, modelling steps, and land-value
September 1, 2026
Commercial Property Valuation: A Practitioner's Guide
Commercial property valuation explained for practitioners, covering income, sales comparison, and cost approaches, data sources, modelling steps, and land-value

The most popular advice about commercial property valuation is to “run all three approaches and average the result.” That sounds prudent, but it can produce a precise-looking number with no defensible connection to buyer behaviour. A valuer's first responsibility is not to calculate more figures. It's to identify which figure the market, lender, tax authority, or reform program needs.
That distinction matters because commercial property sits inside a market estimated at more than US$38.5 trillion in 2024, while EPRA's broader estimate across 75 countries exceeded US$39.4 trillion at year-end 2024. Listed real estate represented roughly US$3.2 trillion to US$3.3 trillion, or about 8.4% to 8.8% of commercial real estate value, according to EPRA's global market table. At that scale, valuation isn't merely an investment memo. It helps determine who pays, who borrows, which sites get developed, and how governments capture the value created by public decisions.
Table of Contents
- Why Commercial Property Valuation Matters Now
- What Valuation Is Really For
- The Three Core Approaches in Practice
- Data Sources and Modelling Steps Behind the Number
- Adjusting Valuation for Policy and Tax Base Design
- Land Leases Versus Land-Use Rights
- Common Pitfalls and Quality Checks
- What Reform-Minded Practitioners Should Do Next
Why Commercial Property Valuation Matters Now
Commercial property valuation is no longer a private document prepared only for a lender, investor, or buyer. A figure certified by an assessor or valuer can shape tax bases, infrastructure cost recovery, borrowing capacity, development feasibility, and land-value reform. The method therefore affects public finance and land policy, not only a transaction.
The market's scale makes small errors consequential. Commercial property was estimated at more than US$38.5 trillion in 2024, while EPRA's broader estimate across 75 countries exceeded US$39.4 trillion at year-end 2024, according to EPRA's global market table. Values also move through cycles rather than following a stable upward path. U.S. commercial property prices recorded a 16.13922% year-over-year increase in April 2006, then reached a -30.24535% year-over-year low in October 2009. More recent FRED readings show -10.66514% in Q2 2024 and -7.01284% in Q2 2025. Those movements show why a valuation date must be treated as a market condition, not a permanent truth.
Method choice is a statement about buyer behaviour
The three core approaches answer different pricing questions:
- The income approach converts expected future income into present value.
- The sales comparison approach tests value against comparable transactions after adjustment.
- The cost approach estimates the cost of recreating land and improvements, allowing for depreciation.
They should not be averaged automatically. The gap between indications can identify the market problem. A cost indication materially above income value may point to functional obsolescence, weak tenant demand, or replacement costs that buyers will not recognise. For investment-grade assets, income capitalisation usually anchors the conclusion because purchasers buy an income stream, while sales evidence tests market credibility and cost analysis helps where improvements are specialised or transactions are thin.
The Tandem Space H1 2026 report provides useful context for office assessments, where submarket conditions, leasing evidence, and asset quality can diverge sharply from broad benchmarks.
Practical rule: Defend the method before defending the number. A valuation that explains buyer logic will withstand scrutiny better than one that simply presents several calculations.
For finance ministries and reform commissions, this discipline determines whether the figure measures an investment interest, a taxable property interest, or the unimproved site value created partly by public action. That choice is also the operational gateway to land-value reform: a true indefinitely held, annually repriced land-use right produces a different measurable base from a fixed-term land lease, so the charging instrument can distort the figures assessors are asked to measure.
What Valuation Is Really For
The same property can require different valuation outputs because the user carries a different risk. A secured lender is primarily concerned with sustainable net income, downside protection, lease durability, and recoverability. An acquisition committee may accept a repositioning plan if the purchase price reflects execution risk. A tax assessor needs consistency across a population of properties. A municipality considering land-value capture needs to isolate the value of the site from the value of buildings and private investment.
That's why “market value” isn't a single universal reading. It's a purpose-built conclusion drawn from common evidence but adjusted to the question being asked.
Lending and investment decisions
For a lender, projected income must be credible under stress. The officer will examine rent-roll quality, tenant covenant strength, lease expiries, vacancy exposure, operating costs, and capital expenditure requirements. A high headline rent is weak security if it expires soon or depends on a tenant who can't support it.
An investor asks a broader question. They care about current income, but also about growth, exit liquidity, redevelopment optionality, financing conditions, and the return required for the asset's risk. The income approach remains central because the buyer is purchasing an income stream, not merely a building.
Taxation and land-value capture
Statutory assessment changes the burden of proof. A tax authority needs repeatability, transparency, and consistent treatment, not just a bespoke opinion prepared for one transaction. Its model must handle differing buildings, leases, locations, and planning permissions without allowing arbitrary adjustments to decide the tax bill.
A land-value reform program goes further. It must distinguish the unimproved land value from improvement value. The highest and best use framework helps clarify whether the relevant site value reflects legally permissible, physically possible, financially feasible, and maximally productive use, rather than the current building's income.
A pure land value tax applies to the value of land while excluding improvements, as described by the Federal Highway Administration's land value tax explanation. That is mechanically different from a conventional property tax, which generally places a charge on land and buildings together.
The practical implication is straightforward: the number must match the institution using it. A lender may capitalise the property's net operating income. A reform commission may need to extract the land residual that the same income stream contains.
The Three Core Approaches in Practice
Practitioners should ask whether each approach mirrors how the relevant buyer prices the asset before applying it. RICS identifies income, sales comparison, and cost methods as core valuation approaches in its guide to valuation methods. The choice also matters for land-value reform: a model built around investment income may measure the whole property, while a reform based on annually repriced land-use rights needs the land component separated from improvements.
Income approach
For investment-grade offices, retail assets, industrial property, multifamily buildings, and hotels, income capitalisation usually anchors the answer. Direct capitalisation converts stabilised net operating income into value through a market-derived cap rate. A discounted cash flow model suits assets with lease rollover, staged occupancy, redevelopment, or changing income that requires an explicit forecast.
The relationship is straightforward. Higher stabilised NOI increases indicated value. A higher required yield or discount rate reduces it, because the same income stream is capitalised at a steeper return requirement. The trade-off is precision versus assumption load: direct capitalisation is transparent when income is stable, while DCF exposes timing and transition risk but depends more heavily on forecasts.
Sales comparison approach
Adjusted comparable sales work best where transactions are active and assets can be compared on meaningful terms. The method often leads for owner-occupied industrial property and development land, where buyers may focus on price per square metre, site characteristics, planning potential, and replacement alternatives rather than existing investment income.
Adjustments must be explicit. Office comparables require review of lease terms, tenant covenant, service charges, floor area, sustainability features, location, and building specification. A similar headline price can conceal materially different risk after those factors are normalised. For land reform, sales evidence can also reveal whether the market is pricing a fixed-term lease, an annually repriced right, or improvements bundled with the site.
Cost approach
The cost approach suits specialised assets such as plants, hospitals, and properties with limited comparable evidence. It estimates land value plus depreciated replacement cost. That result can provide a useful floor or insurance-related reference, yet it may miss the income weakness of an obsolete building or the premium created by a scarce location.
| Approach | Dominant Asset Class | Buyer Logic Mirrored | Key Inputs | Typical Reconciliation Tolerance |
|---|---|---|---|---|
| Income | Investment-grade offices and other income-producing assets | Present value of future income | NOI, vacancy, cap rate, discount rate, terminal yield | 10% to 15% |
| Sales comparison | Owner-occupied industrial property and land | Price paid for comparable opportunities | Transaction evidence, location, size, use, condition | 10% to 15% |
| Cost | Specialised assets such as plants and hospitals | Cost to recreate the required utility | Land, replacement cost, depreciation, obsolescence | 10% to 15% |
When approaches diverge beyond that range, investigate the cause rather than averaging mechanically. Portfolio assignments may also use mass appraisal methods when consistent treatment across many properties matters more than a single bespoke report.
Data Sources and Modelling Steps Behind the Number
A credible model begins before the spreadsheet. Start with the rent roll, lease abstracts, executed leases, outgoings schedules, operating statements, capital expenditure history, title, survey, planning controls, environmental reports, and zoning constraints. A valuer who skips the documents usually ends up modelling assumptions instead of property.
Market evidence should be triangulated. CoStar, RCA, and local Land Registers can provide transaction evidence, while JLL, CBRE, and Colliers publish market commentary and cap-rate benchmarks. The BIS commercial property price dataset adds institutional context, covering more than 20 countries, updated monthly, with nominal prices for commercial land, offices, retail premises, and industrial properties.
From rent roll to stabilised income
The normalisation sequence matters:
- Verify contract rent. Separate passing rent, incentives, abatements, recoveries, and fixed or indexed increases.
- Test occupancy. Replace temporary occupancy with a stabilised assumption supported by submarket leasing evidence.
- Reconcile outgoings. Identify recoverable and non-recoverable costs, abnormal expenses, and owner-paid items.
- Calculate NOI. Move from gross potential income to effective income, then deduct operating expenses and recurring costs.
- Select the yield. Match the cap rate to asset class, tenant quality, lease duration, liquidity, and financing conditions.
A DCF then makes timing explicit. The model forecasts annual cash flows, deducts capital expenditure, estimates a terminal value using a terminal yield, discounts the cash flows at a required return, and calculates the reversionary proceeds at sale.
Worked modelling sketch
Consider a hypothetical 1,000 square metre office with net rent of AUD 650 per square metre, 3% fixed annual escalators, and 95% occupancy. The gross annual contracted rent before the occupancy adjustment is AUD 650,000. Applying the stated occupancy assumption produces effective annual rent of AUD 617,500, before outgoings, incentives, capital expenditure, taxes, and other adjustments.
The terminal yield is 6.25%, so the terminal value equals the stabilised terminal NOI divided by 0.0625. The present value then depends on the explicit holding-period cash flows, the chosen discount rate, the timing of lease events, and the discount applied to the reversion.
| Input | Value | Impact on Value |
|---|---|---|
| Net area | 1,000 square metres | Establishes the income-producing area |
| Net rent | AUD 650 per square metre | Sets initial contracted income |
| Fixed escalator | 3% annually | Increases forecast rent if sustained |
| Occupancy | 95% | Reduces effective income from gross potential rent |
| Terminal yield | 6.25% | Determines the reversion value through capitalisation |
The DCF should be reconciled to direct capitalisation and comparable sales, not treated as automatically superior. A useful supporting reference for separating site economics from building income is this guide to calculating land value.
Adjusting Valuation for Policy and Tax Base Design
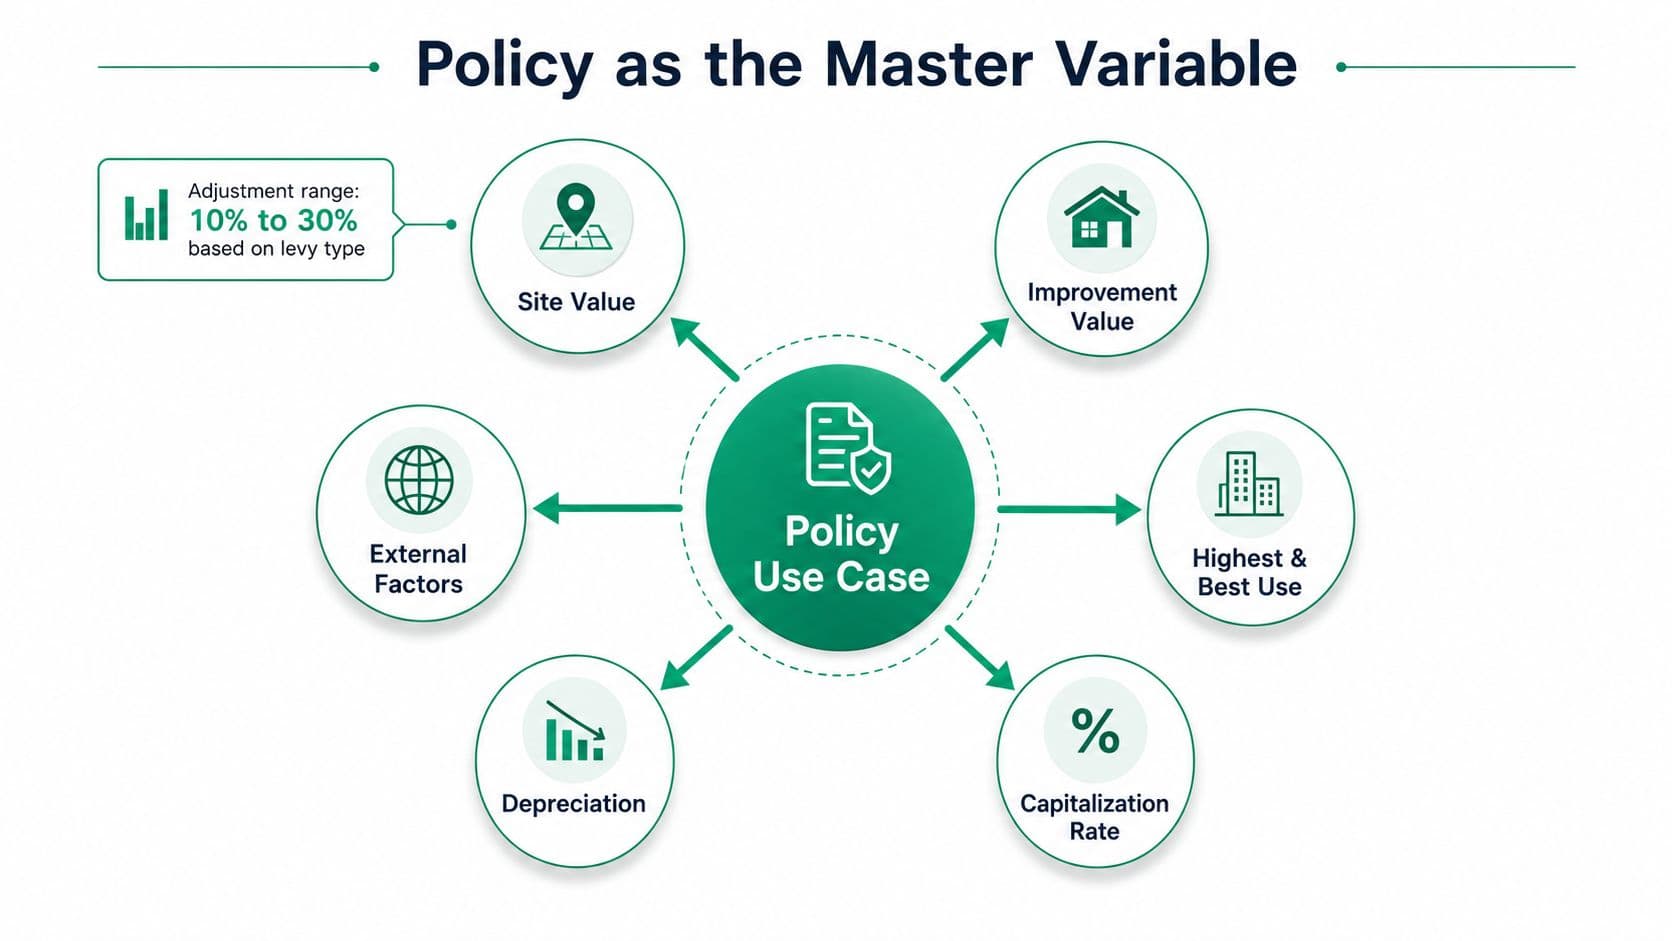
Policy is the master variable because it determines which interest is being measured. A betterment levy, development contribution, split-rate tax, or pure land value tax won't use the same base as a conventional property tax. The assessor must first decide whether the charge applies to land, improvements, transactions, or a combination.
The FAO states that tenure-related taxation is an important revenue source for central and local governments and should be based on appropriate values in its tenure taxation guidance. A land-only base therefore requires a defensible separation between site value and building value. That separation becomes difficult where a property's rent reflects both location and the quality of the improvements.
Leasehold interests and tax incidence
An unencumbered fee simple interest is not the same as a leasehold interest. A fixed ground rent can depress the value of the leasehold estate, while a land value tax applied to the site affects the economics of both ownership and occupation. The valuer must identify the legal interest, contractual rent, term, renewal rights, restrictions, and whether the building owner can capture the site's full rental potential.
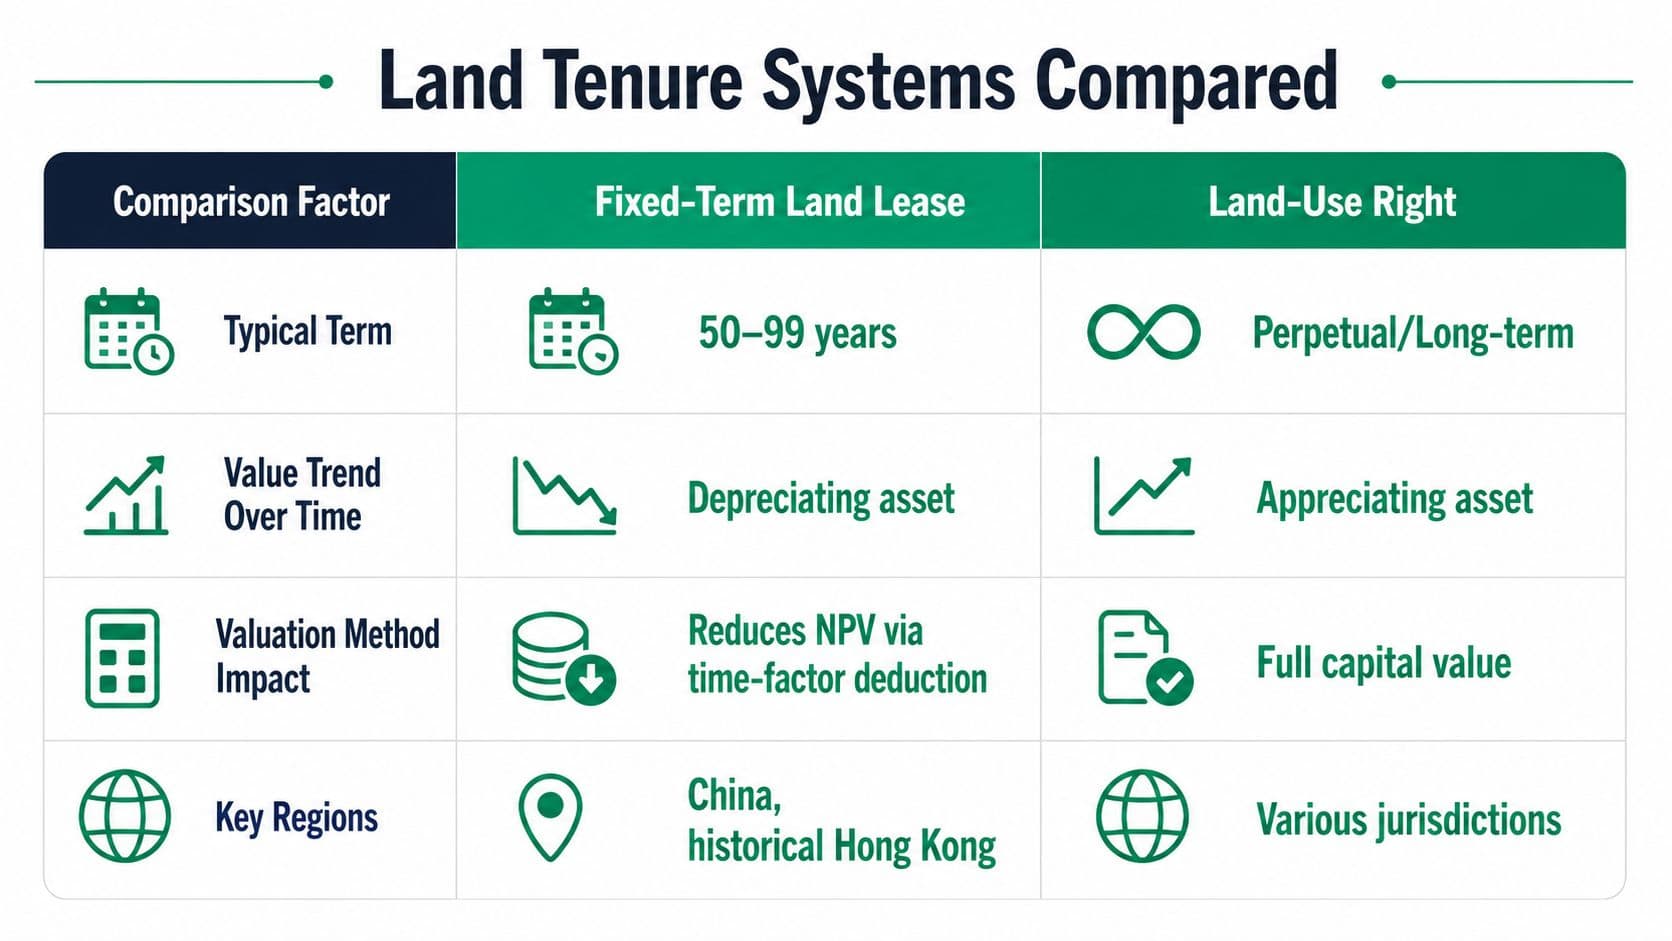
China provides a clear example of a fixed-term land-use system. Urban land remains state-owned, while private users receive land use rights for 40 years for commercial land, 50 years for industrial land, and 70 years for residential land, according to MIT's Urbanizing China course material. These are fixed terms, so they should be analysed as fixed-term rights rather than indefinite annually repriced land-use rights.
Cap-rate sensitivity illustrates the fiscal issue. On AUD 1 million of NOI, capitalisation at 6.25% indicates AUD 16 million of value, while a 6.75% rate indicates roughly AUD 14.81 million. The 50-basis-point shift changes value by roughly AUD 1.19 million, not AUD 77,000, because value equals NOI divided by the cap rate. Any policy model using a 50-basis-point movement must show the arithmetic clearly rather than present a small adjustment as harmless.
For implementation teams considering workflow improvements, see how automates leads provides context on automating lead processes. That kind of automation can support administration, but it can't replace the legal-interest analysis or the valuation audit trail. For a plain explanation of the tax instrument itself, consult what land value tax means.
For policymakers: Publish the valuation basis, the interest valued, the sensitivity band, and the appeal route. A transparent range is more credible than a single figure presented as unquestionable.
Land Leases Versus Land-Use Rights
Terminology causes real valuation errors. A land lease is a renewable or non-renewable fixed-term arrangement with a fixed price. A true land-use right, for the purposes of land-value reform, is indefinite, has no expiration, requires no renewal, and is repriced each year. Sometimes fixed leases are called land-use rights, but a fixed lease remains a fixed lease.
The distinction changes the residual value on the valuer's page. A renewable fixed lease offers certainty only until the term ends. At expiry, the accumulated gap between the fixed lease rate and the market is closed through a major repricing. A non-renewable lease becomes progressively harder to refinance and sell as the remaining term shortens. Fixed pricing doesn't correctly price risk. It postpones risk.
Three tests for the charging instrument
Allocative efficiency favours annual repricing where the objective is to reveal current site value. An indefinite right that adjusts annually allows buyers and sellers to trade without a looming expiry discount. It also avoids burdening productive enterprises with a land charge that remains artificially fixed until a renewal event.
Fiscal capacity can exist under either system, but the timing differs. China's land transfer fees rose from 5.7% of total local budgetary revenue in 1991 to 43.5% in 2008, and local governments collected 2.7 trillion RMB in land leasing fees in 2010, according to the Lincoln Institute's discussion of China's property tax reform. Those figures show the power of upfront lease monetisation, but they also show why lease revenue can create fiscal dependence and expose government finance to land-market cycles.
Administrative feasibility is more demanding for annual repricing. Authorities need a cadastre, consistent valuation models, indexation rules, transaction monitoring, and audit trails. Yet the calculation is conceptually cleaner because assessors don't need to ringfence a depreciating leasehold interest caused by an approaching expiry.
Transition requires care. Existing leaseholders may have paid for an interest under one rule and face a different charge under another. Reformers must address valuation rollbacks, compensation questions, stranded owners, and the treatment of buildings whose value depends on a fixed lease term. Guidance on 99-year land leases is useful for understanding why a long term still isn't the same as an indefinite, annually repriced right.
Common Pitfalls and Quality Checks
A valuation can be internally consistent and still be wrong for the market. The first failure is a bad comparable. Distressed sales, related-party transactions, unusual lease structures, and assets sold with hidden incentives can distort price per square metre. A valuer should walk every transaction back to its legal interest, financing context, occupancy, condition, and date.
The second failure is a stale yield. Published cap rates may lag current credit conditions, especially when private transactions are infrequent or appraisal values are smoothed. Green Street reports its all-property index down 7% over the past year and 21% since its March 2022 peak, with 27 years of index history, as summarised in the BIS-linked market discussion. That kind of repricing is a reminder that a historical yield range can't substitute for current evidence.
Where sector averages mislead
Headline recovery can hide property-specific risk. CoStar reported that by December 2025, the overall U.S. commercial property index was 0.3% above a year earlier but 3.1% below its March 2025 peak. Office values rose 3.8%, while industrial and retail values rose 0.4% each, according to CoStar's 2025 pricing release.
Separate Q1 2025 transaction data showed average price per square foot up 2.6% year over year, with hospitality up 14.8%, retail 5.2%, multifamily 3.9%, office 3.5%, and industrial slightly down, from the same source. These figures don't justify applying one market movement to every asset.
Insurance and replacement-cost risk also deserve a separate check. A 2026 industry report found 68% of buildings were underinsured by at least 25%, while 19% were underinsured by 100%, as reported in the CoStar material. An older or underinsured asset can show acceptable income value while carrying a balance-sheet risk that lenders, owners, and municipalities have ignored.
Five checks before sign-off
- Reconcile the approaches: Investigate differences beyond 10% to 15%, rather than averaging them away.
- Stress the discount rate: Apply a plus or minus 50-basis-point sensitivity and report the resulting value band.
- Walk the comparables: Verify sale conditions, legal interests, incentives, financing, and physical differences.
- Test the income: Compare vacancy, rent, incentives, and outgoings with submarket leasing evidence.
- Match the holding period: Ensure the capitalisation reflects the actual ownership strategy, not the average lease term.
The appraisal gap deserves explicit treatment. Publicly listed real estate was trading at implied cap rates about 130 basis points above private-market appraisals in mid-2026, down from roughly 240 basis points in 2023, according to Forbes Finance Council's coverage of the valuation gap. Diverging assumptions, tighter credit, and inconsistent methodology can leave transaction evidence, private appraisals, and listed pricing temporarily out of alignment.
What Reform-Minded Practitioners Should Do Next
Start with the instrument, not the spreadsheet. If the policy is site-value capture or a land value tax, isolate the land component instead of burying site rent inside a property income capitalisation that combines land and buildings.
Then decide the repricing cadence. True indefinite land-use rights require annual valuation rules, indexation, mass-appraisal models, transaction feedback, and audit trails. A one-off investment appraisal doesn't need the same operating architecture because it answers a different question.
Build the dataset before the policy begins. Collect comparable land sales, ground-rent evidence, planning uplift records, zoning changes, infrastructure effects, and property attributes that explain location value. The model will only be defensible if the authority can show how each input affects the site estimate.
Publish the band, not just the point. A 10% to 15% confidence range makes model risk visible and gives policymakers a more honest basis for appeals, budgeting, and transition design.
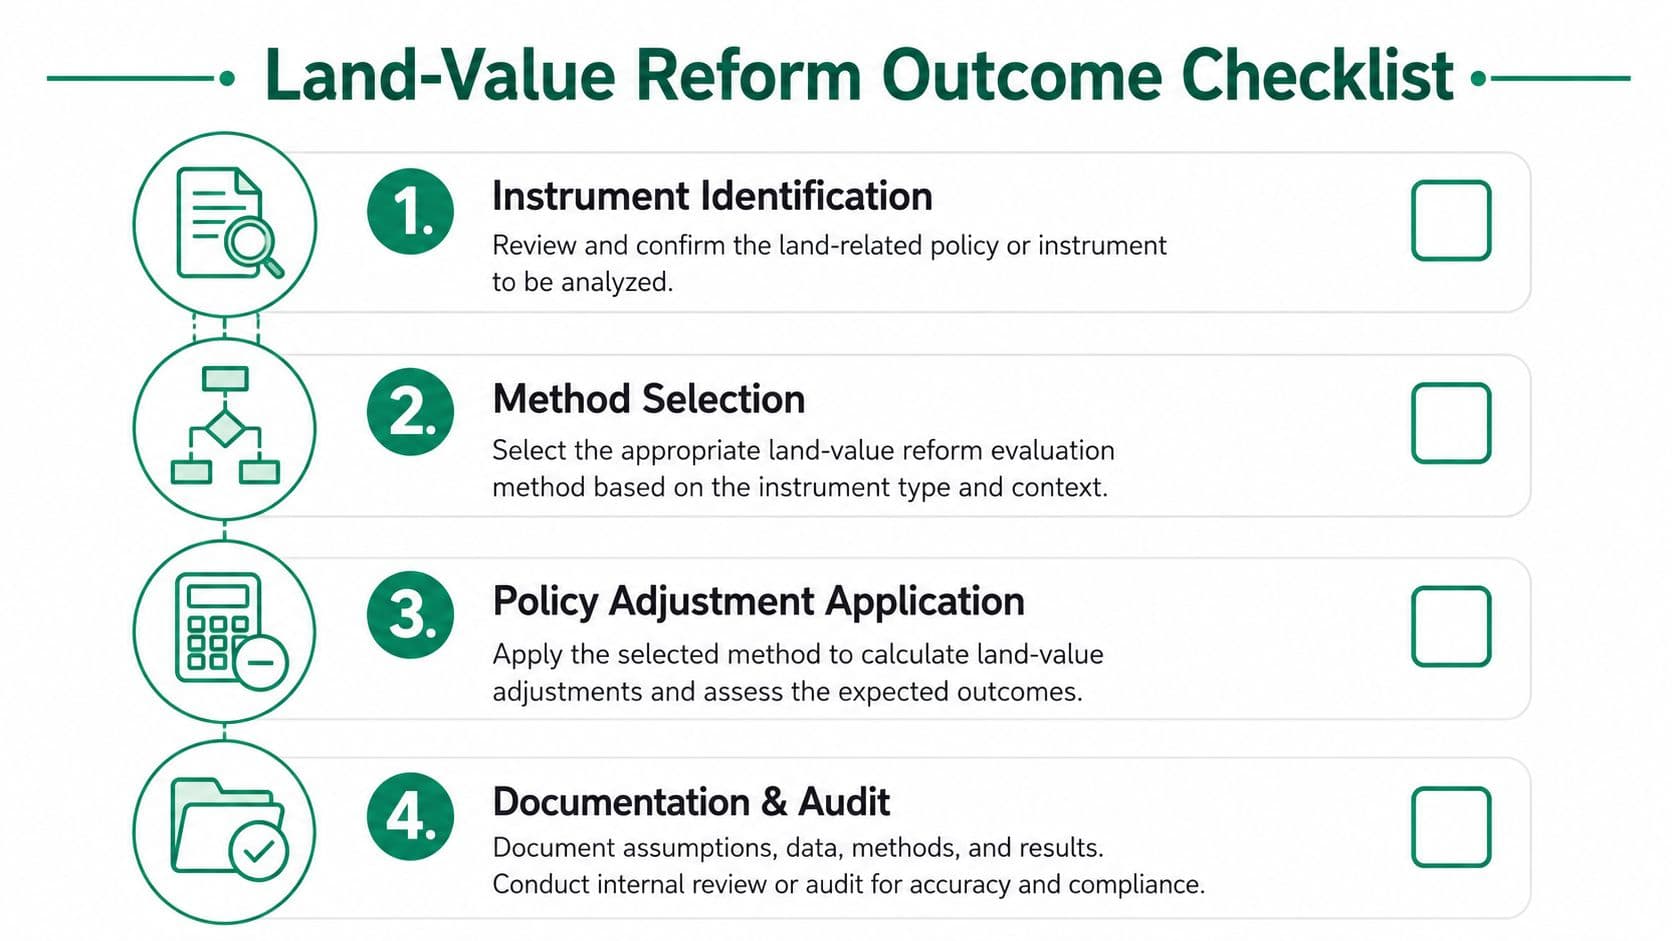
Use this decision checklist:
- Identify the instrument: Is the charge based on land, improvements, transactions, or a combination?
- Select the method: Does the approach mirror the buyer logic and isolate the interest being taxed?
- Apply the policy adjustment: Have lease terms, planning uplift, land residuals, and annual repricing been modelled?
- Document and audit: Can another assessor reproduce the result, test the assumptions, and understand the uncertainty band?
Unitism® offers land valuation assessments, data frameworks, policy design, fiscal impact modelling, implementation support, and public education for organisations evaluating land-value reform. Visit Unitism® to explore its valuation and policy resources, then use the checklist above to define the evidence your own reform program needs.