Explore the housing affordability crisis, its causes, costs, and land-based policy solutions that can make homes genuinely affordable again.
October 2, 2026
Housing Affordability Crisis: Causes, Costs, and Solutions
Explore the housing affordability crisis, its causes, costs, and land-based policy solutions that can make homes genuinely affordable again.

The housing affordability crisis is not merely a shortage of buildings. UN-Habitat reports that 44% of households spend more than 30% of their income on housing, while the burden reaches 55% of renters in Sub-Saharan Africa (UN-Habitat's 2026 World Cities Report). That changes the starting question. Instead of asking only how many homes a country builds, policymakers should ask who owns the land, how its value is created, and who captures the resulting increase.
Housing becomes unaffordable when land prices absorb the gains from better transport, jobs, planning permission, public services, and population growth. Construction costs and interest rates matter, but they often explain the cost of producing a building, not why a well-located site becomes so expensive. The distinction matters because each cause requires a different remedy.
Table of Contents
- The Global Scale of the Housing Affordability Crisis
- Four Structural Drivers of Unaffordability
- How Affordability Is Measured and Why the Numbers Keep Worsening
- Land-Value Taxation and How It Actually Works
- Land Leases vs Land-Use Rights and Why the Distinction Matters
- Case Studies From Denmark Estonia and Singapore
- Why More Supply Alone Will Not Solve the Crisis
- A Practical Toolkit for Land-Value Based Reform
The Global Scale of the Housing Affordability Crisis
The average global price-to-income ratio rose from 9.3 in 2010 to 11.2 in 2023, according to UN-Habitat's 2026 report. Housing prices therefore moved further ahead of earnings over a long post-crisis period. A temporary price spike can be absorbed. A market that separates from incomes year after year cannot.
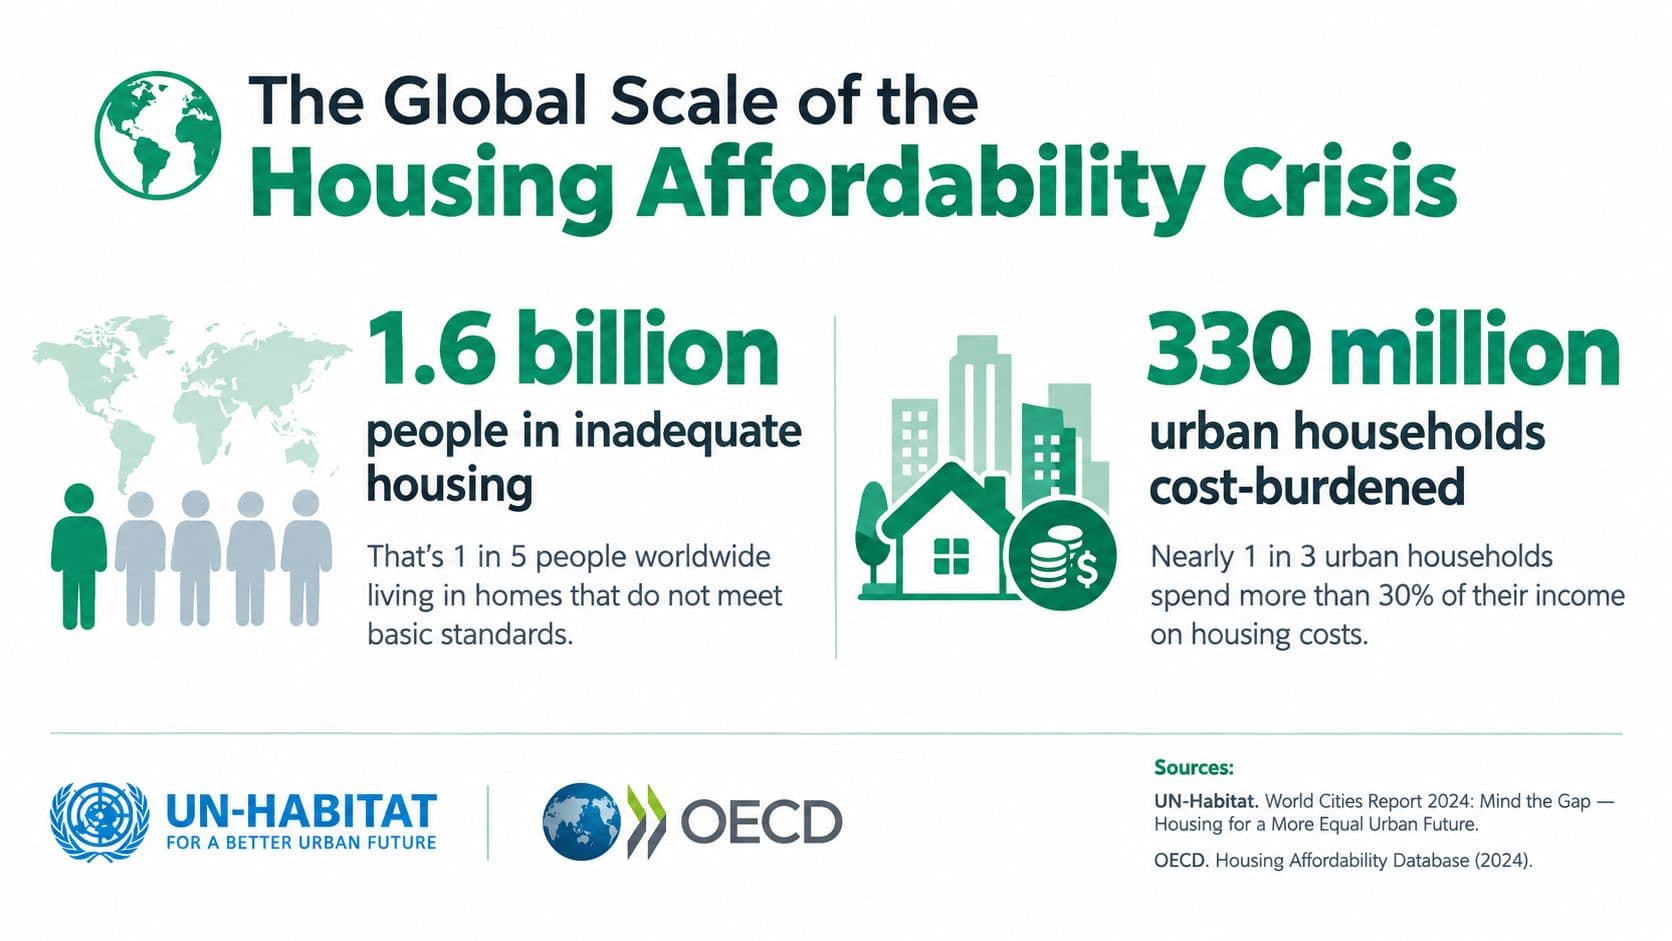
The pressure is strongest in successful urban markets, including wealthy ones. OECD Regions and Cities at a Glance 2024 reports that housing prices in large functional urban areas rose by nearly 68% over the past decade. The increase was 50% in midsize cities, 37% in small cities, and 16% in very small cities. Across OECD regions, households spend nearly one-fifth of disposable income on housing on average. In especially pressured markets, housing takes 35% of household income in Bogotá, 27% in Greater London, and 24% in California.
Why land changes the diagnosis
A building is a produced asset. It can be designed, financed, and constructed, then expanded or replaced. Land is fixed in location. Its value can rise because nearby households, employers, transport networks, public services, and planning decisions make that location more useful.
This distinction changes the policy diagnosis. A building boom can increase the number of homes without making well-located homes affordable. If new infrastructure or permission to build raises site values, sellers may capture much of that benefit through higher land prices. Builders then pay more for sites, even when construction methods improve.
The price of a home combines two different assets: the structure and the site beneath it. Treating them as one makes policy errors easier.
Practical rule: Separate the price of the structure from the price of the site before choosing a housing policy.
The diagnosis includes land speculation, development restrictions, construction-cost pressure, and tax systems that reward holding valuable sites while taxing productive improvements. Interest rates affect financing, and construction costs affect delivery. Land pricing connects these pressures by determining who pays for access to scarce, well-served locations. That is why later reforms must distinguish between taxing land value, leasing land, and granting land-use rights.
Four Structural Drivers of Unaffordability
Housing unaffordability has four interacting causes. Separating them matters because each one changes a different part of the final price. Land speculation raises site values when owners expect future planning permission, infrastructure, or demand to improve a location's resale prospects. The owner can wait for that gain. A builder must pay the higher site price before construction starts.
Development restrictions produce a related effect. Limits on density, height, building type, or permitted uses reduce the floor space that can be created in desirable locations. The economic value of permission is then capitalised into land prices. Fewer homes may be built, but the deeper problem is that the right to build becomes an asset that buyers must purchase through the site.
The four mechanisms
Construction-cost inflation also matters. Material input prices for new residential construction rose 42% between January 2020 and December 2025, while construction-worker employment costs rose 24%, according to Harvard JCHS and related 2026 reporting (MBA NewsLink's summary of the 2026 housing reporting). Those increases raise the rent or sale price a project needs to break even. They do not explain why a valuable site is expensive before materials reach it.
Fiscal policy can intensify the pressure. When buildings and improvements are taxed more heavily than land, construction, renovation, and greater site intensity become less attractive financially. An empty or underused parcel then faces a smaller penalty than a productive one. The tax system can reward waiting, even when the surrounding community needs more homes.
| Driver | Mechanism | Key data point | Effect on land price |
|---|---|---|---|
| Land speculation | Owners wait for gains from location and planning changes | Site value rises without equivalent new construction | Increases the price paid before development |
| Development restrictions | Rules limit the amount and type of floor space | Supply responds weakly in high-demand locations | Capitalises scarcity into sites |
| Construction-cost inflation | Materials and labour raise project break-even costs | Material and worker costs rose sharply over the period | Makes lower-rent projects harder to finance |
| Taxing improvements | Building becomes more expensive relative to holding land | The tax base discourages productive use | Supports idle-site speculation |
These mechanisms can reinforce one another. A restriction limits building, speculation raises the price of permitted sites, and improvement taxes discourage making fuller use of them. Lower construction costs may help, but the saving can be absorbed by higher bids for land. The best-value driver perspective helps clarify why reform must target the source of value, not only the cost of constructing the structure. That distinction also separates a land-value tax from a land lease or a land-use right, which affect ownership, payment, and permission in different ways.
How Affordability Is Measured and Why the Numbers Keep Worsening
Three measures answer three different affordability questions: how far prices have moved beyond incomes, how much housing consumes from a household budget, and whether available homes match people's needs. No single metric captures the full problem.
The price-to-income ratio divides a typical home price by a typical household income. It shows how many years of income the purchase price represents before taxes, maintenance, interest, and other living costs are included. The ratio rose from 9.3 to 11.2 between 2010 and 2023, according to UN-Habitat. That movement indicates that prices have outpaced earnings over time. A median, however, can conceal heavier pressure on renters, younger adults, and lower-income families.
The housing cost burden measures the share of income spent on rent or ownership costs. UN-Habitat uses more than 30% of income as a threshold in its global reporting, and reports that the burden affects 44% of households worldwide (UN-Habitat's World Cities Report overview). The measure identifies immediate budget stress, much like a monthly cash-flow test. It can still miss households that keep costs below the threshold by accepting overcrowded, distant, or poor-quality housing.
Read the metric before accepting the headline
A vacancy rate counts unoccupied homes. It does not establish whether those homes are affordable, suitable, or located near jobs and services. Inventory can rise while households remain excluded if available properties sit in the wrong neighbourhoods or price brackets. A market can also cool after a major price increase, leaving homes far beyond local incomes even when the latest figures look less dramatic.
| Metric | Definition | What it reveals | Main limitation |
|---|---|---|---|
| Price-to-income ratio | Home price relative to household income | Long-term purchasing power | Hides differences between households |
| Housing cost burden | Housing expenditure as a share of income | Immediate budget pressure | Does not fully capture quality or overcrowding |
| Rental affordability | Rent compared with earnings and household needs | Conditions facing tenants | Can vary sharply by neighbourhood |
| Inventory and vacancy | Homes listed or unoccupied | Market availability | Does not show whether homes are affordable |
These measures should be read together. Land values, rents, incomes, vacancies, and the distribution of costs show whether the pressure comes from a broad price shift or falls most heavily on particular households. A guide to quality-of-life measurement provides a plain-language framework for selecting indicators and interpreting their welfare effects. The choice of measure shapes the policy diagnosis, including whether reform focuses on household support, housing supply, or the land prices that absorb much of the gain from development.
Land-Value Taxation and How It Actually Works
A land-value tax applies to the value of the site, not to the value created by buildings. The FHWA defines it as a tax levied only on land value, while Brookings explains that shifting the burden from structures to land can encourage more intensive development and reduce the price buyers are willing to pay for a site because the buyer also acquires the continuing tax liability (FHWA explanation of land-value taxation).
The mechanism is simple. If a vacant parcel and a developed parcel of similar location face the same land charge, the owner gains less from waiting with the site idle. If the tax on the building is reduced or removed, construction and renovation become less costly at the margin.
Assessment and transition
A government must estimate the unimproved value of each site. Assessors can use sales comparisons, rental evidence, location characteristics, permitted development capacity, and statistical models that separate land value from building value. The assessment doesn't need to pretend that the structure is worthless. It needs to identify which part of the total value belongs to the location.
A split-rate system taxes land at a higher rate than buildings. A revenue-neutral transition can hold total public revenue broadly steady while shifting the burden away from structures and toward sites. The change should be phased in, independently reviewed, and paired with clear appeals procedures because valuation errors can create real hardship.
Consider a property whose total value consists of two components, land and structure. Under a conventional property tax, the authority applies one rate to the combined value. Under a split-rate system, it applies a higher rate to the land component and a lower rate to the structure component. If the two rates are calibrated to produce the same initial revenue, the immediate fiscal effect can be neutral while the long-run incentive changes.
| Component | Conventional property tax | Split-rate land-value tax |
|---|---|---|
| Land | Taxed together with the structure | Taxed at the higher rate |
| Building | Included in the same tax base | Taxed at a lower rate |
| Empty site | May face a relatively modest burden | Faces a stronger incentive to be developed |
| Renovation | Can increase the tax bill | Receives greater protection from tax increases |
The policy isn't magic. It can create payment problems for asset-rich, income-poor owners, and reassessment can be politically difficult. Governments need deferrals, hardship rules, transparent valuations, and careful distributional modelling. For a fuller introduction to the instrument, see what is land-value tax.
Land Leases vs Land-Use Rights and Why the Distinction Matters
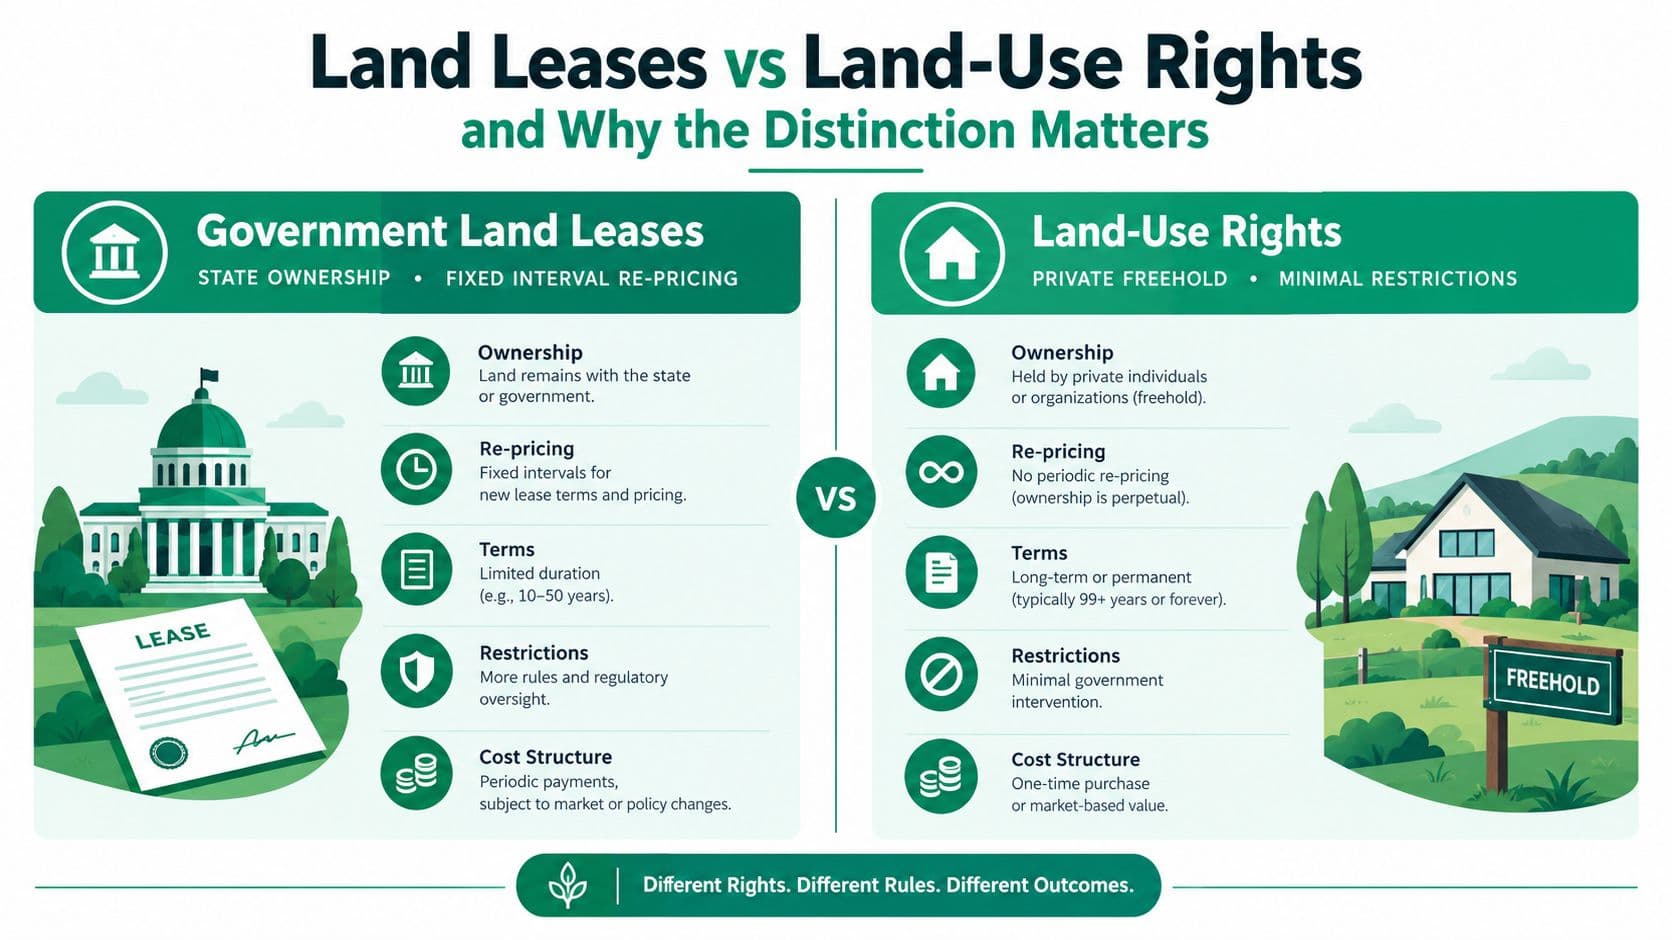
A fixed-term land lease gives a person or company the right to use land for a defined period. The state or another landowner retains the underlying ownership. The lease may be renewable or non-renewable, but the essential feature is the expiry date and the need to manage repricing risk.
A land-use right, in the sense used here, is different. It has no expiration, requires no renewal, and is repriced annually. Because the right continues indefinitely and its annual charge reflects current land value, people can buy and sell it without waiting for a major end-of-term decision. It prices access to land continuously rather than postponing the adjustment.
Why expiry changes household risk
Singapore illustrates the fixed-term model. The Singapore Land Authority says most residential leasehold titles run for 99 years, while most industrial leases run for 60 or 30 years. The authority also states that leases normally expire without renewal, and that renewal, when considered, requires an application within specified timing conditions and payment of a land premium based on current value (Singapore Land Authority lease policy). A fixed lease can provide certainty during its term, but that certainty doesn't eliminate the risk. It moves the risk toward renewal, resale, and the remaining term.
Singapore's official Bala's Table guidance says leasehold value varies with the remaining term and doesn't decline at a constant annual rate (Singapore's Bala's Table guidance). That affects mortgage collateral and intergenerational transfers. A household approaching lease decay may find that lenders, buyers, and heirs assess the asset differently from a household holding an indefinite right.
A fixed lease postpones risk. An annually repriced, indefinite land-use right makes the charge visible and continuous.
UN-Habitat describes lease arrangements ranging from 2 to 99 years, with payment through an upfront charge, a leasehold charge, or annual rent (UN-Habitat report on land and adequate housing). A fixed lease must not be called a land-use right merely because it grants use. If it expires or requires renewal, it remains a fixed lease.
For the implications of long fixed terms in housing markets, see this explanation of 99-year land leases. The central policy choice is whether government wants to collect land value through a visible annual charge or through occasional, disruptive repricing events.
Case Studies From Denmark Estonia and Singapore
These three countries illustrate different institutional choices, but the available evidence must be handled carefully. They shouldn't be reduced to slogans such as “public ownership works” or “privatisation solves affordability.” The decisive questions are how land value is assessed, when it is collected, and whether households hold an indefinite right or a wasting lease.
Denmark and public value capture
Denmark is useful as an example of a system in which land taxation and public control of urban development can enter the policy mix. The analytical lesson is that a public authority can capture part of the value created by planning and infrastructure rather than allowing every increase to flow into private site prices. That approach still requires credible valuation, predictable rules, and protection against sudden burdens on households.
Estonia and the transfer of rights
Estonia belongs in the comparison because land-rights reform can produce a different distribution of wealth from lease auctions. The relevant policy question is whether land is transferred into private hands. It is whether recipients hold an indefinite, transferable right and whether the public sector continues to capture location value through annual charges. Without that continuing mechanism, a one-time transfer can leave future gains to speculation and create new affordability pressures.
Singapore and fixed-term control
Singapore provides the clearest sourced example of fixed-term state land leasing. Its residential leases generally run for 99 years, and its industrial leases generally run for 60 or 30 years, according to the Singapore Land Authority. The model gives the state a continuing role in land allocation, but households must price the remaining term and the possibility that renewal will require a land premium.
| Country | Land ownership model | Reform or policy mechanism | Affordability lesson |
|---|---|---|---|
| Denmark | Public and private land interests combined with land taxation | Capture part of location value through public policy | Valuation and tax design determine who receives land gains |
| Estonia | Private land rights after institutional transition | Transfer of rights can broaden ownership | One-time transfer doesn't replace ongoing land-value capture |
| Singapore | State ownership with fixed-term leases | Allocate land through leasehold arrangements | Fixed terms control access but create expiry and resale risk |
The comparison is not a contest between national labels. It is a test of tenure design. An indefinite right with annual repricing creates a different mortgage, inheritance, and investment environment from a lease that becomes harder to refinance as its end approaches.
Why More Supply Alone Will Not Solve the Crisis
Supply is necessary, but unit counts alone cannot show whether new homes reach households under the greatest pressure. A city may add dwellings while affordability worsens if those homes appear in the wrong locations, at the wrong price points, or on land whose value has already been bid up.
Construction costs help explain the pressure. Between January 2020 and December 2025, material input prices for new residential construction rose 42%, while construction-worker employment costs rose 24%, according to Harvard JCHS reporting summarized by MBA NewsLink. Developers facing higher costs may favour higher-rent projects because their revenue is more likely to cover land, finance, labour, and materials.
Yet land pricing determines how much of that revenue remains available for housing. If planning permission or new infrastructure raises a site's expected value, the gain can flow to the landowner rather than reduce the final price. More construction then treats the symptom without changing the mechanism that makes well-located sites expensive.
The same reporting found that units renting for less than $1,400 fell by 9.3 million between 2014 and 2024, while units at $1,400 or more increased by 11.8 million. In 2024, 22.7 million renter households, or 49% of renters, were cost-burdened, including 12.1 million severely burdened households.
| Supply question | Why it matters |
|---|---|
| Where are units built? | Location affects access to jobs and services |
| Which price tier expands? | High-end homes may not help cost-burdened renters |
| Who receives land gains? | Site prices can absorb construction efficiencies |
| Which reform changes that result? | A land-value tax captures value annually, while a lease or land-use right changes control and tenure |
The practical conclusion supports an affordable housing playbook: build more, while changing how land value is formed and distributed.
A Practical Toolkit for Land-Value Based Reform
A workable reform program starts with measurement, not a tax announcement. Governments should publish price-to-income trends, housing cost burdens, site assessments, development capacity, vacancy by price tier, and the distribution of land gains. The aim is to identify whether a project is expensive because its structure costs more or because the site captures expected future value.
Four tiers of action
-
Diagnose the land share. Use property transactions, rents, planning permissions, building costs, and geographic data to estimate site values. The obstacle is technical capacity and public trust, so assessments need transparent methods and appeals.
-
Shift the revenue base. Introduce a split-rate property tax or land-value tax, with a phased transition and hardship protections. A revenue-neutral tax reform framework can help policymakers model who gains, who pays, and how public revenue changes.
-
Choose tenure deliberately. Use fixed leases only when the public purpose justifies expiry risk. Where indefinite land-use rights are used, reprice them annually so households and firms don't face a sudden end-of-term reset.
-
Capture and steward land. Public land banking and community land trusts can separate the cost of a home from the speculative price of the underlying site. Their success depends on governance, resale rules, financing, and a durable land-value policy.
Citizens can ask local councils, legislators, and finance ministries five concrete questions:
- Will you publish land and building values separately?
- Will new infrastructure value be captured for public benefit?
- Will tax reform reward construction rather than vacant land holding?
- Will housing data show affordability by income and price tier?
- Will tenure rules disclose expiry, renewal, and repricing risk clearly?
Unitism® offers research, land valuation assessments, policy design, distributional modelling, implementation support, and education for land-value based reform. Visit Unitism® to explore how land pricing, taxation, and tenure design can be evaluated together.