Use this Land Value Tax Calculator guide to compare site-value and property-value methods, check inputs, and read results with worked examples.
November 4, 2026
Land Value Tax Calculator: Inputs, Method and Results
Use this Land Value Tax Calculator guide to compare site-value and property-value methods, check inputs, and read results with worked examples.

If a property owner adds a workshop without changing the land beneath it, should their annual tax bill rise? A conventional property-value calculation can say yes. A land value tax calculator separates the site from the improvements, but that distinction alone doesn't tell you what the owner will pay.
For a policy team, the useful result isn't just an estimated bill. It's a comparison showing how valuation assumptions, ownership rules, rates, and transition measures change both public revenue and the burden on different owners.
Table of Contents
- Inputs a Land Value Tax Calculator Needs
- Land Leases Versus Land-Use Rights
- How to Calculate Land Value Tax Step by Step
- Site-Value Versus Property-Value Methods
- Two Parcels Under Each Method
- Why Two Calculators Give Different Answers
- Who Gains and Who Pays After a Reform
- Check the Model Before You Recommend a Reform
Inputs a Land Value Tax Calculator Needs
A land value tax calculator estimates a charge from land value alone, excluding buildings and other improvements. Before entering anything, establish whether the tool calculates an existing statutory liability or models a proposed reform. An official assessment and an exploratory scenario can use similar inputs without producing equally authoritative results.
Inputs required by a land value tax calculator
| Input | Where it comes from | Why the calculator needs it |
|---|---|---|
| Site value of each taxable parcel | Valuer-General or assessor annual valuation | Sets the taxable base, with buildings and improvements excluded |
| Valuation date | Assessment notice or valuation roll | Fixes which year's values and rates apply |
| Owner and aggregation rules | Land register or ownership record | Combined holdings can move into higher brackets |
| Exemptions and thresholds | Tax statute or agency guidance | Small holdings may owe nothing below a threshold |
| Rate schedule | Current year's published rate table | Flat or progressive rates change the result |
| Improved property value | Capital improved value or assessment | Needed for the property-value comparison |
| Land share of total value | Site value divided by improved value | Shows how much the burden could shift when improvements leave the tax base |
Use the table as a lookup, not as permission to substitute whichever valuation is easiest to find. A sale price, mortgage valuation, and taxable site assessment answer different questions.
Identify the assessed value
Victoria provides a concrete distinction. Its Valuer-General supplies annual site value, covering land alone, and capital improved value, covering land plus buildings, fences, and other capital improvements, as explained by the State Revenue Office Victoria. The annual valuation reference date is 1 January, and site value supports land-tax calculations and council rating.
South Australia's general land tax calculator similarly asks for taxable site value for the relevant financial year. Entering a combined property value in that field would include improvements the calculation is meant to exclude.
If you must estimate the land component, document the approach rather than deducting an assumed building cost without explanation. Different methods of land valuation require different evidence and assumptions.
Assemble the ownership record
A flat percentage of a parcel's market price isn't an adequate substitute for the jurisdiction's rules. Aggregation can move an owner into a higher bracket, while exemptions can remove particular holdings from the taxable total.
Before opening the tool, collect:
- Parcel reference: Match the calculation to the correct assessment record.
- Latest site-value notice: Check the valuation basis and effective period.
- Owner's total taxable land: Include holdings that must be aggregated.
- Current rate table: Confirm the ownership category, thresholds, and exemptions.
Keep the source document beside each input. That makes the calculation auditable when someone asks why a parcel was included, excluded, or assigned a particular value.
Land Leases Versus Land-Use Rights
| Feature | Fixed-term lease (renewable or non-renewable) | Land-use right (as defined here) |
|---|---|---|
| Term | Fixed period | No expiration |
| Renewal | Required at term end for renewable leases | Not required |
| Pricing | Fixed rent until renewal or expiry | Repriced annually |
| Gap with market rent | Builds up, then closes in one repricing | Reassessed each year |
| Ease of buying or selling | May become harder as expiry approaches, especially without renewal | Annual repricing is part of the arrangement |
| Risk | Repricing risk postponed until renewal or expiry | Charge updated annually to reflect land value |
Land leases and land-use rights describe different arrangements. A land value tax is a public charge on the value of land itself. A lease or land-use right sets the terms under which someone occupies or uses land.
Here, a fixed-term lease has a set duration and price. A land-use right is indefinite and repriced annually. These are definitions for comparing tenure arrangements, not universal legal categories.
Apply the tenure tests
Use the term “land-use right” in this narrower sense only if the arrangement meets all three tests:
- Annual repricing: The land charge is reset each year.
- No renewal: Continued possession does not depend on signing a replacement agreement.
- No expiration: The right has no terminal date.
A label alone does not determine how an arrangement works. If it has a fixed term or requires renewal, it does not meet this definition of a land-use right.
A renewable lease can provide certainty during its term. At renewal, however, the agreed rent may be reset, closing any gap between that rent and the current market level in one step. With a non-renewable lease, the remaining term shrinks over time, which may affect the ability to sell or refinance the interest.
Fixed leases postpone repricing risk until renewal or expiry.
An indefinite right with annual repricing handles that risk differently: the land charge is updated each year rather than held fixed until a later reset. Annual repricing is a design feature of this arrangement, not a guarantee of low transaction costs.
The land-value theory behind separating land from improvements helps clarify what is being priced. A land charge applies to the value of the land, not to buildings or other improvements. In a calculator, specify whether the scenario uses a fixed-term lease or an indefinite, annually repriced right, since their pricing and expiry rules differ.
How to Calculate Land Value Tax Step by Step
Begin with a calculation record containing the jurisdiction, financial year, ownership category, currency, and source of each valuation. For an Australian scenario, keep inputs and outputs in AUD throughout.
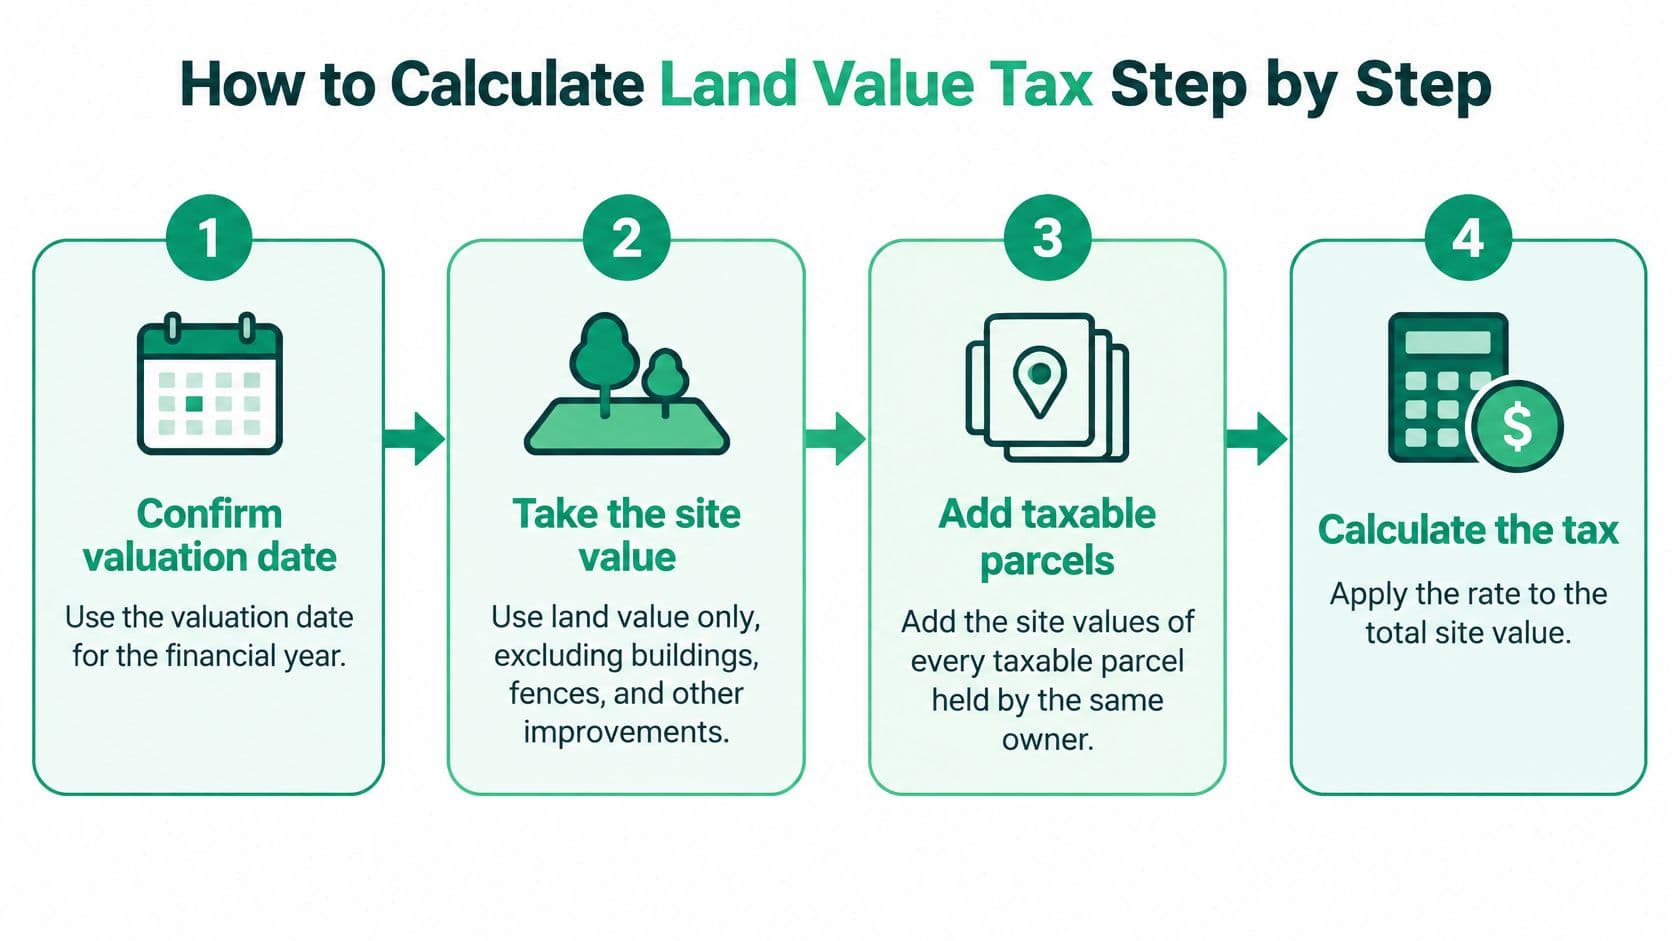
The diagram summarises the workflow. In a progressive system, calculating the tax requires the full bracket schedule, not just the highest displayed rate.
Build the taxable assessment
-
Confirm the valuation period and take the site value. Use the assessment applicable to the financial year, excluding buildings, fences, and other improvements. Don't mix a recent sale price with an older statutory valuation.
-
Add the taxable parcels subject to aggregation. Match each holding to the relevant owner or ownership category before combining values. Don't assume parcels held through different legal arrangements receive identical treatment.
-
Apply exemptions and thresholds as the law specifies. Remove exempt holdings or apply deductions only where authorised. A tax-free bracket isn't necessarily a deduction that can be claimed again against every parcel.
South Australia illustrates why timing matters: its land-tax calculation guidance assigns liability to the owner recorded at midnight on 30 June before the financial year, with annual site valuations applying from 1 July through 30 June of the following year. The guidance also requires aggregation of taxable site values owned by the same person before applying the progressive structure.
Calculate and reconcile the charge
-
Apply the marginal schedule. Multiply each taxable slice by its own rate, then add the resulting charges. If the official table uses a base charge plus a marginal rate above a bracket boundary, reproduce that formula instead of adding the base charge twice.
-
Check the ownership date. Confirm that the taxpayer in the model is the liable owner on the statutory date. A current ownership search doesn't necessarily establish who owed the assessment for an earlier period.
-
Compare with the baseline bill. Subtract the existing liability from the modelled liability and report the change in AUD. Calculate percentage change against the existing bill, and mark it as undefined if that baseline is zero.
The common shortcut is to apply a flat rate to one parcel's market price. That bypasses the assessment basis, ownership aggregation, and marginal brackets simultaneously.
Reconciliation check: The charges calculated for individual bracket slices must sum to the reported total.
For a valuation-only sensitivity test, hold the legal rules constant and change only valuation inputs. For a different financial year, recheck the rules and rate schedule as well.
Site-Value Versus Property-Value Methods
| Criterion | Site-value method | Property-value method |
|---|---|---|
| Base taxed | Land only | Land plus buildings and improvements |
| Effect on construction | Does not penalize building or renovation through the improvement value | Taxes improvements as they are added to assessed value |
| Typical input | Site value | Capital improved value |
| Land-rich, building-light site | Higher relative charge under a comparable-revenue shift | Lower relative charge under that comparison |
| Building-rich site | Lower relative charge under a comparable-revenue shift | Higher relative charge under that comparison |
| Best use in a calculator | Reform scenarios and distribution | Baseline against existing bills |
The directional comparisons describe a shift between tax bases with comparable revenue objectives. They aren't promises about absolute bills: rates, exemptions, and the wider assessment roll still determine the result.
The U.S. Federal Highway Administration's land value tax guidance defines the tax as applying solely to land and recommends regular reassessment as population, zoning, infrastructure, and market conditions change. The reassessment schedule follows state or local law, so a calculator must identify its valuation cycle.
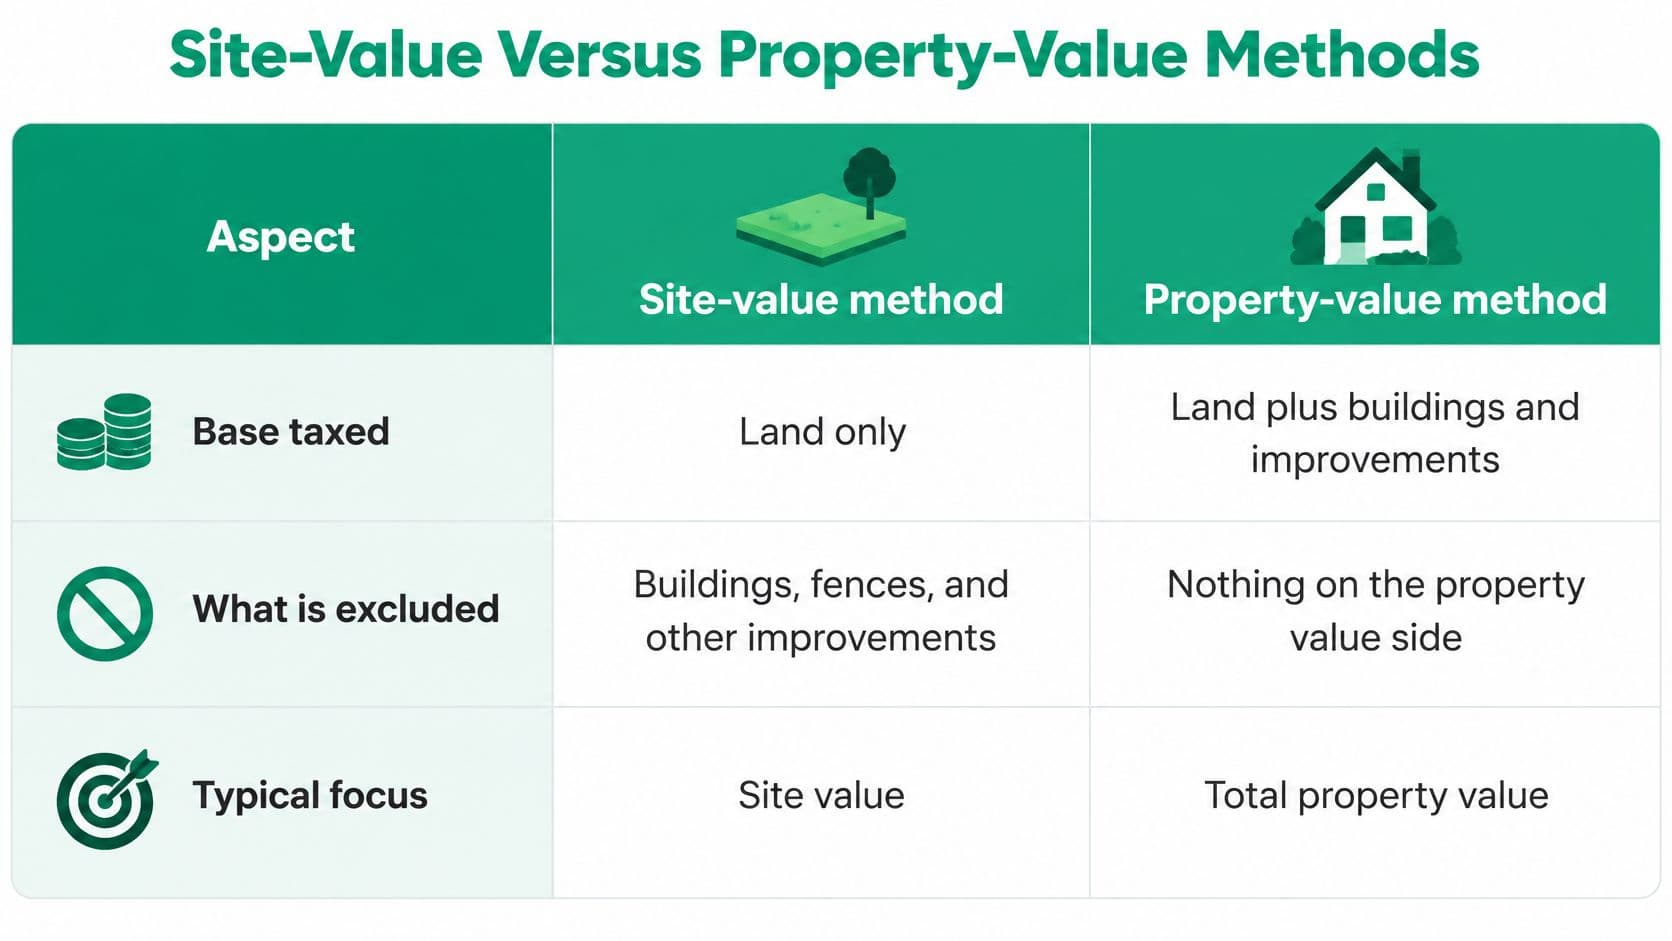
Choose the method for the policy question
- Model a reform: Use site value when testing removal of improvements from the tax base.
- Examine investment incentives: Separate the charge on location from any charge triggered by construction.
- Identify distributional changes: Compare the methods parcel by parcel, then group the results.
- Benchmark an existing bill: Use the property-value method when it matches the current assessment system.
The land value tax versus property tax comparison is most useful when you keep the baseline explicit. A model that changes both the tax base and the rate cannot attribute the entire bill difference to excluding buildings.
Separate the base effect from the rate effect
Run a controlled comparison before selecting a revenue target. Hold the parcel records, ownership treatment, and exemptions constant, then identify which assumptions you change between runs.
A same-rate comparison shows the arithmetic consequence of narrowing the base, but it doesn't establish a financially sustainable reform. A revenue-targeted comparison answers a different question: what rate would collect the intended amount from the new base?
Keep both outputs where useful. The first explains the mechanism; the second supports budgeting.
For a tangible comparison, enter the same parcels under each method and display the result in local currency. In the Australian examples below, that means AUD rather than mixing Australian assessments with pound-denominated outputs.
Two Parcels Under Each Method
All values and rates below are hypothetical illustrations, not the rates or assessments of any jurisdiction. Both methods use AUD, with no exemptions or aggregation beyond the parcels described.
Hypothetical parcels under site-value and property-value methods
| Item | Parcel A (land-rich) | Parcel B (building-rich) |
|---|---|---|
| Site value | AUD 400,000 | AUD 150,000 |
| Improved value | AUD 600,000 | AUD 750,000 |
| Land share | Approximately 67% | 20% |
| Site-value method at 1% of site value | AUD 4,000 | AUD 1,500 |
| Property-value method at 0.5% of improved value | AUD 3,000 | AUD 3,750 |
| Difference, site-value minus property-value | +AUD 1,000 | −AUD 2,250 |
Test the bracket schedule first
Before using the flat-rate comparison, apply a hypothetical progressive schedule to Parcel A: 0.5% on the first AUD 250,000 and 1% above it.
- Lower band: AUD 250,000 × 0.5% = AUD 1,250.
- Upper band: AUD 150,000 × 1% = AUD 1,500.
- Total charge: AUD 1,250 + AUD 1,500 = AUD 2,750.
That result isn't the flat-rate charge of AUD 4,000. The difference comes entirely from applying the lower rate to the first slice, demonstrating why a calculator must reproduce brackets rather than use the top marginal rate everywhere.
Compare the flat-rate scenarios
For Parcel A, the illustrative site-value calculation is AUD 400,000 × 1% = AUD 4,000. The property-value calculation is AUD 600,000 × 0.5% = AUD 3,000. The site-value method adds AUD 1,000, approximately one third more than the property-value baseline.
For Parcel B, AUD 150,000 × 1% produces AUD 1,500, while AUD 750,000 × 0.5% produces AUD 3,750. The difference is a reduction of AUD 2,250, or 60% of the property-value baseline.
The explanation is the land share, calculated as site value divided by improved value. Land represents approximately 67% of Parcel A's total value but only 20% of Parcel B's. Removing improvements from the base therefore changes their relative positions substantially.
A lower combined property value doesn't necessarily mean a lower bill after a shift to land taxation.
These illustrative rates aren't revenue-neutral across the parcels. A revenue-neutral reform requires calibrating the relationship between the baseline and reform rates across the full taxable roll, which changes the individual results again.
Repeat the exercise with local valuations and the applicable rate schedule. Preserve the current bill as the baseline, and label every alternative as either a statutory estimate or a hypothetical policy scenario.
Why Two Calculators Give Different Answers
The assumption many users miss is that land value is often estimated, not directly observed. Buyers commonly purchase land and buildings together, leaving the assessor to separate their contributions to the combined price.
The Welsh Government's 2026 valuation-methodologies review found that different methods can produce different answers for the same site, that no single optimal method has been agreed, and that values displayed to the nearest pound remain uncertain.
Identify what the calculator estimates
The review describes several approaches:
- Market methods: Infer site value from relevant transactions.
- Income methods: Estimate value from an attributable income stream.
- Cost methods: Separate estimated improvement value from total property value.
- Administrative methods: Apply standardised assessment procedures.
- Proxies and spatial interpolation: Use related indicators or nearby observations where direct evidence is limited.
- Fixed land-to-property ratios: Assign a specified proportion of total value to land.
- Hybrid methods: Combine approaches and evidence.
Calculators can disagree because they use different comparables, assumptions, or valuation dates, without either containing an arithmetic error. In rural or low-volume markets, limited transaction evidence leaves more of the estimate dependent on modelling choices.
That doesn't make every estimate equally defensible. A model should explain why its evidence fits the parcel's location, permitted use, and development constraints.
Report uncertainty without disguising it
A useful result should distinguish observed records from modelled assumptions. Display a base case alongside a plausible range, and explain what would move the estimate toward either end.
- Method and vintage: State how the value was derived and when the underlying evidence was collected.
- Confidence: Describe evidence quality without inventing statistical precision.
- Sensitivity: Test zoning, infrastructure, permitted density, and land-use assumptions separately.
- Tax response: Show how alternative valuations change liability under the same rules.
A precise-looking tax result can still rest on an uncertain site valuation. Keep computational accuracy separate from valuation confidence.
To challenge an assessment, request the valuation method, comparable evidence, and parcel assumptions. Check the local objection procedure and submit any appeal within the legally specified window, supported by evidence addressing the assessor's actual method.
Who Gains and Who Pays After a Reform
Who gains from a land value tax, and who faces a higher bill? The answer depends on each property's land value, the tax rules, and how the reform changes other taxes or public spending.
The 2026 Maryland fiscal note describes a Virginia study in which residential burdens could decrease while business burdens increased. It also says owners with larger land shares would pay more under a land-value tax. These are modelled outcomes, not proof of what a particular municipality's reform would produce.
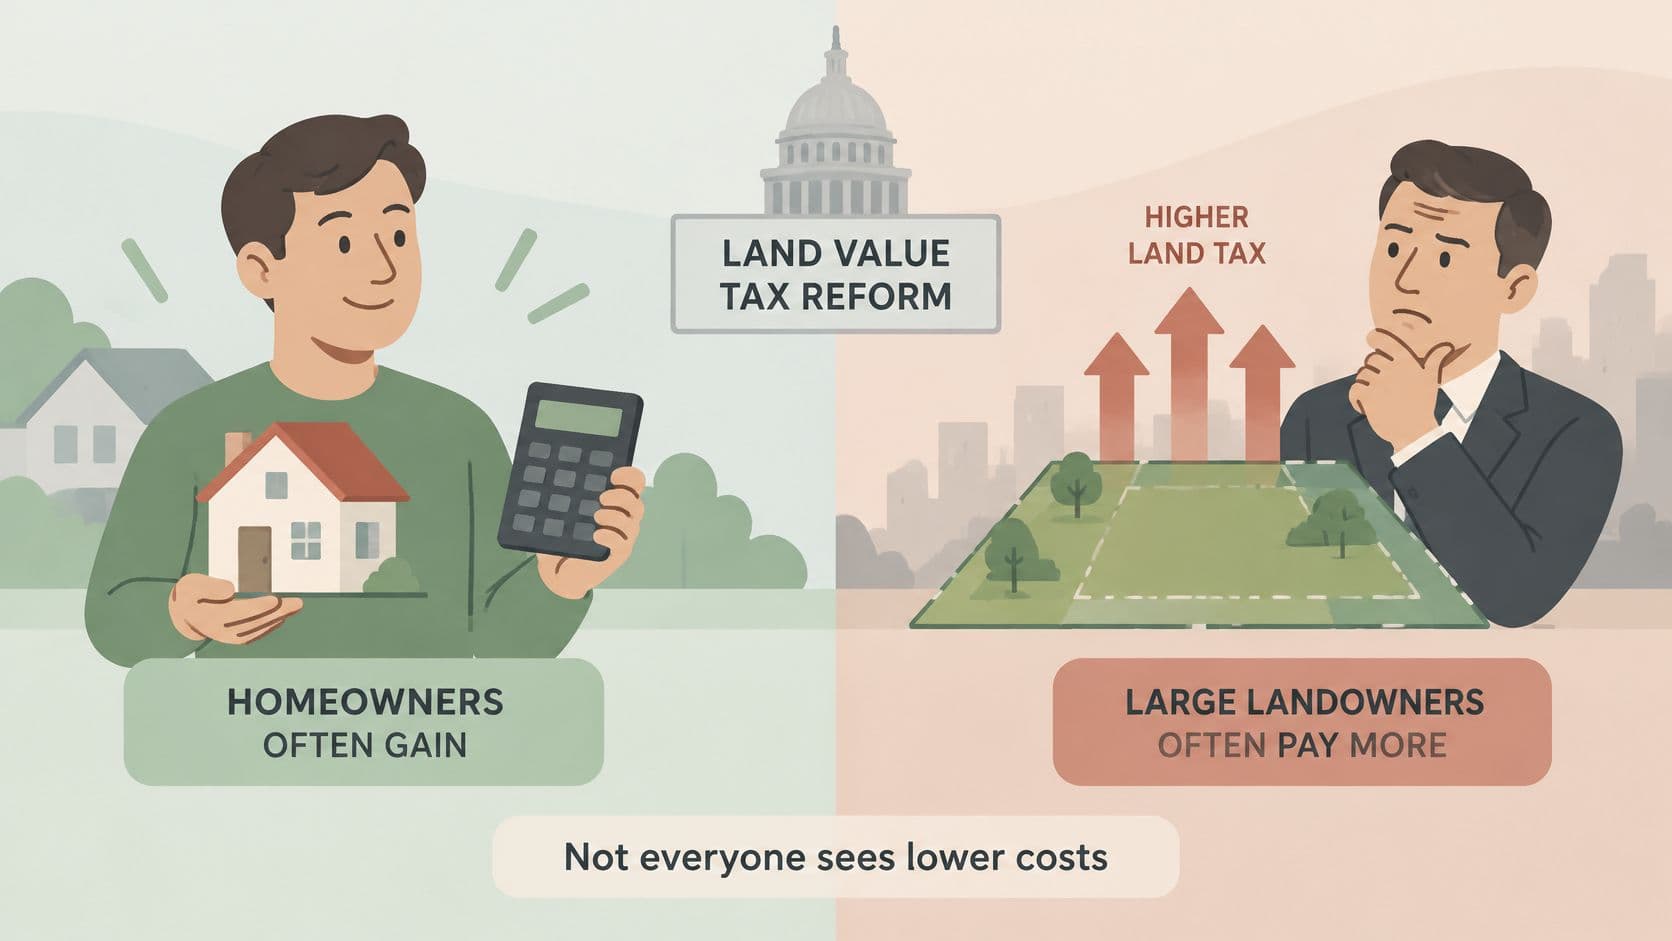
Require a transition dashboard
A policy-facing calculator should show:
- Gross land-based charge: The assessment before transition assistance.
- Change against the existing system: The difference in currency and as a relative change.
- Revenue-neutrality check: Whether the reform meets its intended collection target.
- Phase-in periods and caps: How the initial bill compares with the eventual liability.
- Rebates and exemptions: Who qualifies and how relief is funded.
- Revenue recycling: How replacement taxes, public spending, or distributions affect the wider outcome.
A distributional analysis of tax reform should separate changes in the tax bill from changes in disposable income or housing costs. A rebate can reduce the transition burden without changing the underlying assessment. Replacing another tax can change a household's net position.
Examine property types separately
Residential property needs more than an average result. Compare homes by land share, location, exemption status, and ownership category. Also distinguish annual liability from an owner's ability to pay.
Commercial property can combine a valuable location with modest or substantial improvements. Don't assign every business the same assumed land share or treat all businesses as landowners.
Vacant sites have little improvement value to remove from the assessment. Their relative burden may therefore rise when the revenue requirement shifts toward land.
Highly improved sites may move in the opposite direction because buildings make up more of their combined assessment. The applicable rate and relief still determine the final bill.
Renters need a separate incidence scenario. Landlords may absorb the charge, try to pass it through, or face changes in asset prices. Supply, demand, and market conditions affect the result, so don't add a landlord's tax increase directly to a tenant's rent.
Set local assumptions for property composition, market conditions, and transition rules. National defaults can illustrate how a reform works, but they cannot establish who gains and who pays in a particular municipality.
Check the Model Before You Recommend a Reform
- Verify the valuations. Record the valuation date and source of every site value, including the relevant assessor's notice.
- Confirm the legal treatment. Match aggregation, exemptions, and thresholds to the jurisdiction's statute rather than a generic template.
- Run both methods. Use the same parcels to compare site-value and property-value assessments.
- Test the range. Apply sensitivity-analysis techniques to zoning, infrastructure, and permitted density assumptions.
- Reconcile revenue and distribution. Check the collection target and separate residential, commercial, and vacant-property outcomes.
- Document the model. Preserve assumptions, data vintage, valuation method, and a reproducible calculation record.
Move from exploration to implementation
Complete these checks before seeking implementation support. At Unitism®, we work with governments, cities, and organizations on assessing land values, designing the policies that collect them, and modelling who gains and who pays.
Our Interactive Tools are simple models showing how land shapes the economy. They help explain mechanisms, but a policy recommendation still needs jurisdiction-specific assessments and rules.
Your next step is to list your jurisdiction's inputs using the opening table, then choose a single reform scenario to model first. Define the baseline and revenue objective before selecting the alternative rate.
Unitism® offers land valuation, policy design, and fiscal and distributional modelling to help turn a calculator scenario into an assessable reform proposal. Visit Unitism® to explore support for testing your jurisdiction's land values, revenue target, and transition options.