Explore revenue forecasting models for public finance & land-value capture. Guide covers model types, data, validation, & governance strategies for 2026.
July 22, 2026
Public Finance Revenue Forecasting Models Guide 2026
Explore revenue forecasting models for public finance & land-value capture. Guide covers model types, data, validation, & governance strategies for 2026.

You're in a budget meeting with a stack of land-value capture proposals on the table, and everyone wants the same answer: how much revenue will arrive, and when. If the forecast is too low, a transport link, drainage upgrade, or housing-enabled redevelopment can stall for lack of funds. If it's too high, the public sector can lock itself into debt service that the tax base can't support.
That's why revenue forecasting models matter in public finance. They turn policy assumptions, parcel data, and market behavior into a forecast that budget officers can defend, revise, and explain. For a practical policy frame that connects land, buildings, and revenue design, Unitism's land value capture guide is a useful companion, and so are modern AI support strategies that show how structured workflows can make complex public-facing systems easier to manage.
Table of Contents
- Introduction to Revenue Forecasting in Land-Value Capture
- Understanding Key Concepts and Policy Distinctions
- Comparing Model Types for Land-Value Projects
- Assessing Data Requirements and Quality Issues
- Selecting and Validating Forecasting Models with Uncertainty
- Establishing Governance and Operational Processes
- Case Studies and Practical Recommendations
- Conclusion and Next Steps for Implementation
Introduction to Revenue Forecasting in Land-Value Capture
A finance director in a housing ministry may approve a redevelopment plan, see a transit upgrade moving ahead, and still face one hard question, will land-value capture produce enough revenue to support today's borrowing? That is the practical test in policy design. Land-value capture only works when analysts can translate future receipts into a forecast that is credible enough for budgeting, debt service, and governance review.
The task sits between policy ambition and cash-flow reality. In land-value capture, the forecast has to reflect more than the number of transactions. It must account for pricing, timing, renewals, and revenue recognition, because a land value tax, a tax increment financing district, or another capture mechanism can generate receipts on different schedules and under different rules. Public finance teams often use time-series models, regression models, bottom-up or pipeline models, and scenario-based models, and many agencies combine 2 to 3 models rather than relying on one estimate alone.
Practical rule: if the policy can change land values, development timing, or tax increments, the forecast needs to show how each lever affects revenue, not just a single top-line number.
Unitism's tri-factor economics adds another layer of discipline. A land-value capture forecast should be read alongside the underlying land value, the policy instrument, and the operational setting that turns legal authority into collected revenue. The same logic applies to a land value tax or a special assessment district. The model has to reflect how the asset base can change, how the rule set allocates receipts, and how administration affects collection. For a plain-language overview of the policy mechanism, this guide to land-value capture is a useful starting point.
Public finance teams also need enough history before relying heavily on quantitative methods. One useful benchmark is 12 to 24 months of monthly revenue data before leaning on formal models. That matters even more in land-value capture, because redevelopment, zoning changes, and infrastructure timing can create uneven revenue patterns that are hard to read in a short series.
Good forecasting also depends on operational discipline. Strong model selection is only part of the job. Analysts still need clear data ownership, review steps, and contingency plans if development timing slips or the tax base expands more slowly than expected. That is why public finance teams should treat revenue forecasting as a governance process, not a spreadsheet exercise, much like the controls used in modern AI support strategies, where monitoring and escalation matter as much as the tool itself.
Understanding Key Concepts and Policy Distinctions
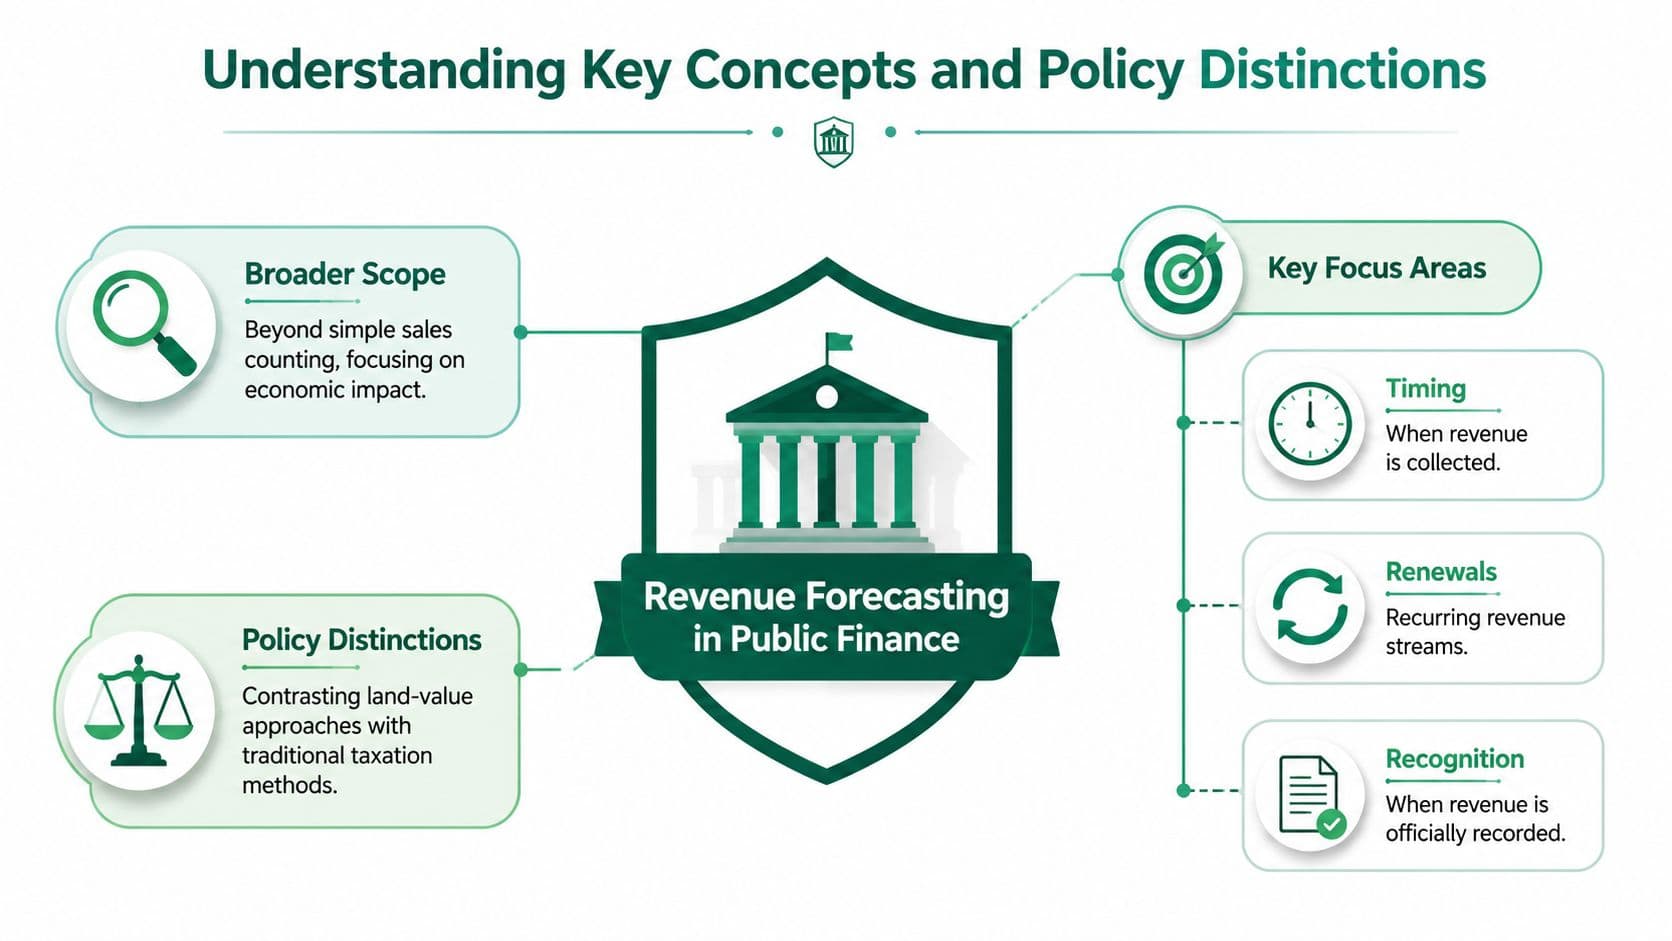
Revenue forecasting in public finance starts with scope. A ministry analyst is not only asking how many parcels will change hands. The larger question is what revenue will be recognized, on what schedule, and under which policy rules. That broader lens separates forecasting from a simple activity count, and it forces analysts to distinguish the mechanics of the tax base from the timing of collection.
Revenue forecasting in public finance
A forecast is closer to a government ledger with moving entries than a static estimate. Timing shows when revenue is collected, renewals shape recurring streams, and recognition marks when revenue is officially recorded. In land-value capture, those three can diverge from the moment a project is approved. A model that only tracks expected value can still miss the budget window if collection lags or the revenue base is phased in slowly.
Land value taxes and land-use rights
A land value tax is levied only on the value of unimproved land, not on buildings or other improvements, and split-rate systems tax land at a higher rate than improvements FHWA on land value taxes. That distinction matters because the tax base is the site, not the structure, a key difference when comparing a land value tax vs. a traditional property tax. A vacant lot can face the same property-tax bill as an adjacent lot with a four-story apartment building when the assessment is based on site value rather than structures Local Housing Solutions on land value taxation.
Land-use rights work differently. Virginia's land-use-value program taxes eligible land by current class of use, requires qualifying land to have been devoted to that use for at least five consecutive years, and lets each county, city, or town decide whether to adopt it Virginia Tech on land-use-value taxation. In plain language, a land value tax treats the site like a seat in a theater, while land-use rights behave more like a renewable arrangement tied to use status rather than market value.
Tri-factor economics and forecast logic
Unitism's tri-factor economics separates land, capital, and labor, which helps analysts avoid mixing site value with building value or payroll effects. That separation is especially useful in reform design, because a tax on land is meant to change site-use incentives, while a tax on structures can distort investment decisions. For policy analysts, the forecasting question is not only how much revenue a measure will raise, but also what exactly is being taxed, how the tax base is defined, and what behavior the tax will encourage.
Comparing Model Types for Land-Value Projects
Land-value projects don't all need the same model. A narrow district with stable assessment data can often be handled with a straightforward time-series or regression approach, while a redevelopment corridor with phased infrastructure, zoning changes, and uncertain absorption may need a scenario model or a bottom-up pipeline forecast. The right choice depends on the revenue stream, the data, and the policy question, not on which method sounds most advanced.
| Model Type | Key Features | Use Cases |
|---|---|---|
| Time-series | Uses past patterns such as seasonality, trend, and moving averages | Stable tax receipts, recurring assessment cycles, seasonal public revenues |
| Regression | Estimates revenue as a function of drivers like land value, pricing, development intensity, or macro conditions | Land-value capture tied to zoning, transit access, or tax base growth |
| Bottom-up or pipeline | Builds revenue from parcels, projects, or stages of development | TIF districts, phased redevelopment, project-by-project capture estimates |
| Scenario-based | Tests best case, base case, and downside assumptions | Debt-backed instruments, uncertain land markets, policy reforms |
| Ensemble | Combines more than one model to balance strengths and weaknesses | Complex public revenue settings where no single model is enough |
| Machine learning | Learns nonlinear patterns from many variables | Large datasets with multiple drivers and noisy relationships |
The evidence on newer methods is mixed, which is exactly what public analysts need to hear. In a 2022 study of public-revenue forecasting, generalized regression neural networks (GRNN) outperformed some machine-learning methods overall, but classical methods such as ARIMA and double exponential smoothing still did better for certain tax revenue streams Taylor & Francis study on public-revenue forecasting. That result supports a practical rule, newer isn't automatically better.
For policy design, the decision often turns on interpretability. A regression model can show how a change in a driver moves revenue, which makes it easier to explain in a budget hearing. A machine-learning model can handle more complexity, but if it's too opaque for auditors or elected officials, it may create a governance problem even when the fit looks strong.
Policy lens: use the simplest model that can still explain the mechanism behind the revenue stream, then add a second model only if it materially improves validation.
For district-based reforms, a TIF-style forecast usually starts with parcel-level logic and then layers in timing, absorption, and growth assumptions. That makes the model more operationally useful than a single high-level trend line, especially when the fiscal question is tied to a TIF district's revenue mechanics.
Assessing Data Requirements and Quality Issues
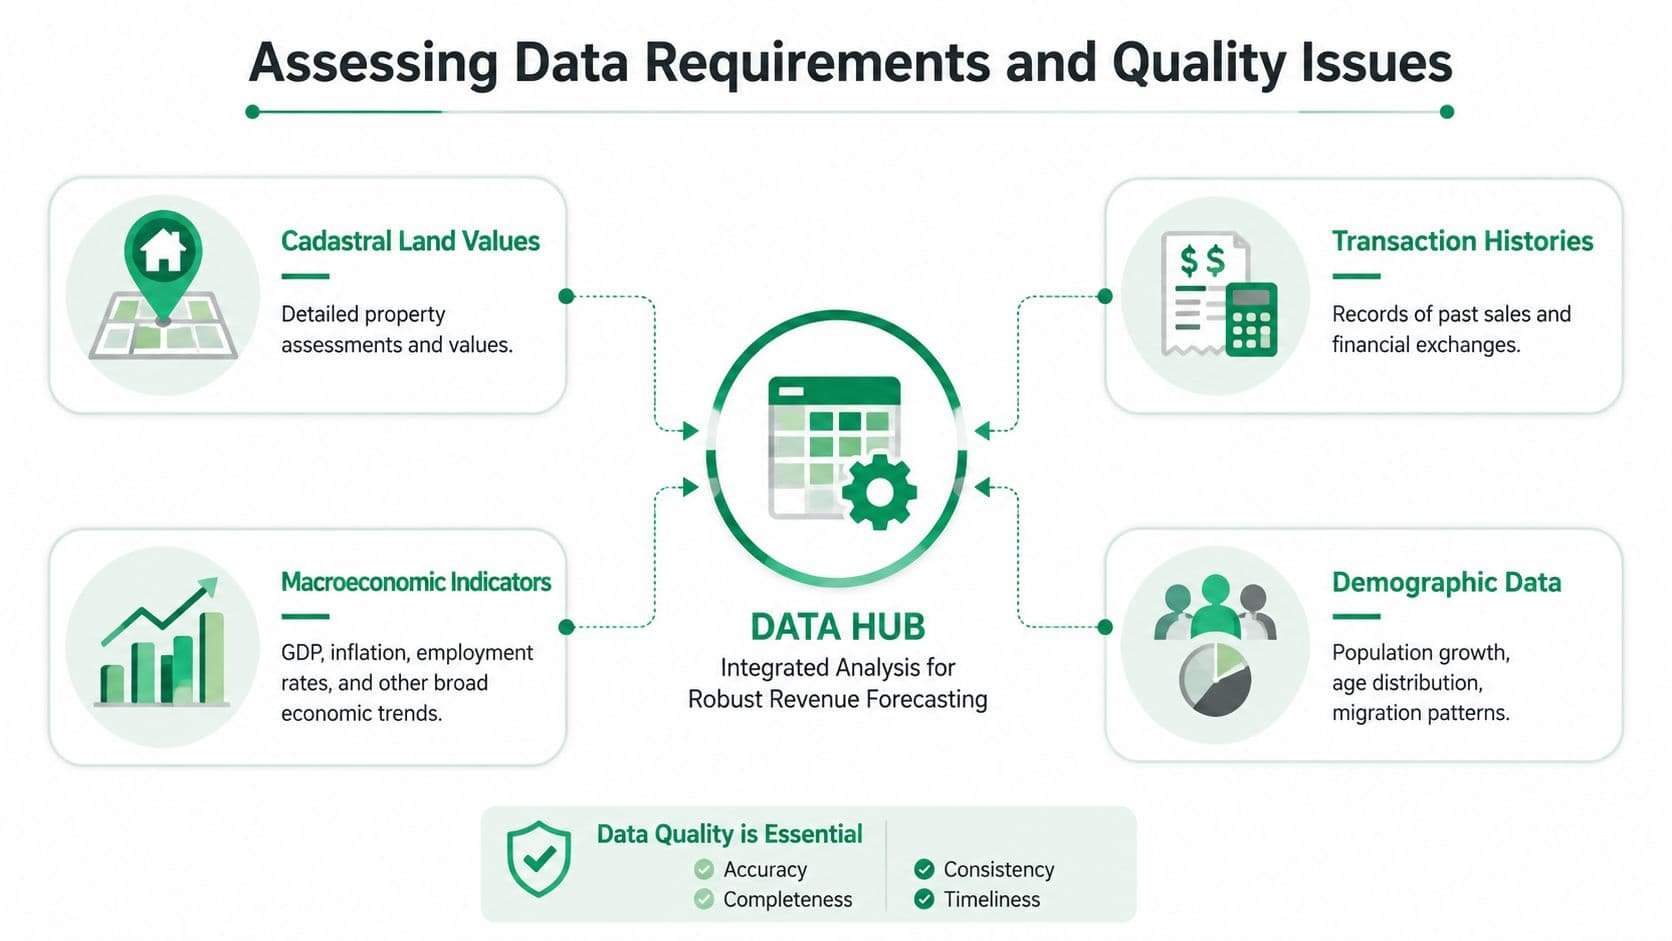
A land-value capture forecast starts with a simple question, what evidence shows that future revenue will materialize when the policy takes effect? For finance ministry analysts, the answer usually sits across parcel assessments, transaction histories, zoning records, infrastructure timing, and broader economic indicators. If redevelopment is part of the policy design, demographic trends also matter, because they help explain whether housing, office, or retail demand can absorb the projected space at the pace the model assumes.
What the data needs to show
A finance ministry does not need every possible dataset. It needs the records that explain the revenue mechanism from assessment base to cash flow. Cadastral land values show the current tax or levy base, transaction histories show how the market is moving, macroeconomic indicators frame demand conditions, and demographic data help explain who may occupy the redeveloped space.
That logic becomes clearer if you separate signal from noise. A parcel register can tell you what exists on paper, while sale prices show what buyers are willing to pay. If those two views diverge, the gap may point to a delay in reassessment, a coding issue, or a real market shift that should be modeled rather than ignored. Analysts also need to keep the policy purpose in view, because a forecast built for a borrowing plan needs a different level of evidence than a draft note for early-stage design.
Why the history window matters
A short history can make a forecast look precise while hiding volatility. Many forecasting frameworks recommend at least 12 to 24 months of monthly historical revenue data before relying heavily on quantitative models CBH on revenue forecasting methods. That kind of history gives analysts a base for comparing driver patterns, seasonal movement, and policy changes, which is more defensible than leaning on intuition alone. In public finance, where commitments can outlast a budget cycle, a weak starting dataset can turn into a costly assumption.
For land-value capture, the history window should also match the development timeline. A district that is still being assembled will not behave like one that already has completed buildings and assessed uplift. Analysts should therefore read the historical series as a policy record, not just a numerical one, because the timing of zoning approvals, infrastructure delivery, and reassessment can shape the revenue path as much as the market itself. That is also where calculating land value becomes more than a valuation exercise, since it helps show how much uplift is visible enough to forecast and how much remains hidden in the policy pipeline.
Common data problems
Missing records, inconsistent intervals, and outliers are the usual traps. A reassessment lag or a change in parcel coding can make a district look healthier or weaker than it really is, much like reading a budget from only half the ledgers. Analysts should document every cleaning choice, because a forecast that cannot be reproduced will not survive a budget challenge.
Practical rule: if the land valuation agency updates values on a different schedule from the revenue system, treat the gap as a modeling assumption, not a minor bookkeeping issue.
A useful operational step is to compare official valuations with observed transaction behavior, then note where the gap is structural rather than accidental. That comparison can also support quantifying AI uncertainty, since a model that sits on uncertain inputs should surface that uncertainty instead of hiding it. If the valuation series and market activity move in different directions for a clear policy reason, the forecast should reflect that split rather than forcing the data into a single story.
Selecting and Validating Forecasting Models with Uncertainty
Choosing a model is really a matching exercise. If the revenue stream is stable and seasonal, a time-series model may be enough. If the policy depends on changing drivers, a regression model may be better. If the forecast must support debt issuance, analysts usually need a scenario layer on top, because the question isn't only what is likely, it's what happens if assumptions move.
How to validate without fooling yourself
Backtesting tells you whether the model would have worked on earlier periods. Holdout sets test performance on data the model never saw. Cross-validation helps when the data is limited, because it cycles through multiple train-test splits. Together, these methods make it harder for a model to look good only because it fit the past too closely.
The most important uncertainty question in land-value capture is whether the uplift is large enough to exceed development costs. In that setting, the core step is estimating incremental land-value uplift versus development costs, and small changes in land price growth or cost assumptions can flip a project from surplus to deficit Centre for Cities on land-value capture modeling. That's why sensitivity analysis is not a luxury, it's part of the forecast itself.
What to document
A strong forecast file should say which variables mattered most, which assumptions were held constant, and where the model is fragile. It should also show how far the forecast can move before the policy stops working. If the answer is “not much,” the ministry may need a more conservative financing structure.
For readers who want a plain-language definition of uncertainty quantification, the key idea is simple, don't present one forecast as if it were the only future. Give decision-makers a range, then explain which assumptions produce the low and high cases.
A forecast is defensible only if a skeptical reviewer can trace the numbers back to the assumptions and repeat the result.
For land-value capture analysis, fiscal impact analysis belongs in the same evidence bundle, because revenue risk and public-cost exposure need to be judged together.
Establishing Governance and Operational Processes
Forecasts fail as often because of weak process as because of weak math. A ministry can have a technically sound model and still produce unreliable budget numbers if nobody owns the inputs, version history, or approval cycle. Governance is what keeps the forecast tied to the administrative reality of assessments, collections, and project delivery.
Who should own what
A practical governance setup gives data stewards responsibility for source integrity, model custodians responsibility for methods and revisions, and budget officers responsibility for how the forecast enters the fiscal plan. That separation matters because each group sees a different failure mode. Data stewards notice missing files, model custodians notice drift, and budget officers notice when the forecast no longer fits the appropriation timetable.
How the workflow should move
The workflow should start with the cadastre and revenue system, then move through validation, sign-off, and publication. Version control needs to be strict enough that staff can reconstruct the numbers behind any budget submission. Audit trails should show when assumptions changed, who changed them, and why.
For a useful governance reference outside public finance, metrics governance offers a helpful parallel. The lesson translates well, if a team can't explain how a metric is defined, refreshed, and reviewed, it can't rely on that metric for decisions.
The same logic applies to stakeholder reviews. Elected officials don't need to see every line of the model, but they do need a clear summary of the assumptions, risks, and fallback options. Training matters too, because analysts who understand the policy design are less likely to treat the forecast as a black box.
Case Studies and Practical Recommendations
A city finance team may look at a land-value-capture forecast and ask a basic question, where does the new revenue come from? The answer usually starts with the policy design. Analysts separate the frozen baseline from future growth, then test parcel-level reassessments against phased development schedules and conservative discounting. The strongest versions of this approach do not assume that all growth arrives at once. They let the development timetable shape the tax path World Bank land value capture guidance.
A TIF district example
A city finance team once built its first pass from headline district growth alone. The result looked promising, but it ignored lot-by-lot timing and treated new occupancy as immediate. When the team shifted to parcel-level reassessments and staged development, the revenue profile became slower but more credible, which made debt sizing safer.
The lesson was not that the project failed. The lesson was that timing in the tax base mattered as much as size. For finance ministry analysts, that is the difference between a forecast that sounds attractive and one that can support borrowing, cash planning, and collection schedules.
A land-value tax pilot example
A statewide land-value tax pilot raises a different set of questions. The issue is less about one district's increment and more about how assessments, behavioral response, and communication fit together. A useful pilot usually combines scenario modeling with stakeholder workshops so assessors, budget staff, and local officials can compare the status quo path with reform paths before anyone commits to implementation.
In that setting, zoning changes and redevelopment intensity matter because the policy is designed to reward use, not speculation. A land value tax encourages development and discourages speculative holding. The pilot still needs a transition plan so local governments understand how collections will move from one tax base logic to another. In Unitism's tri-factor economics, analysts should also test how land, labor, and capital respond separately, because a model that blends them too quickly can hide the policy effect the reform is meant to create.
Seven practical recommendations
- Start with the revenue mechanism: define whether the policy is a land-value tax, a TIF-style increment, or a broader capture tool before building the model.
- Use parcel-level inputs where possible: district averages are useful for headlines, but they can hide the timing that drives debt service.
- Build at least one scenario model: policy decisions need a downside case, not just a central estimate.
- Validate against earlier periods: backtesting exposes assumptions that only look good in-sample.
- Document every reassessment lag: if valuation timing differs from cash collection, note it clearly in the forecast.
- Keep governance separate from modeling: the people approving the forecast should not be the only people editing it.
- Match the fiscal design to the land theory: if the reform separates land from capital and labor, the forecast should do the same.
A final point is often missed in public discussions of land policy. If a jurisdiction is considering land value taxation, analysts should also explain land-use rights, because the two mechanisms are not interchangeable. Land-use rights are annual leases that are repriced each year and have no expiration dates, which is why they can be bought and sold at low cost, while a land value tax remains a tax on site value rather than a lease structure.
Conclusion and Next Steps for Implementation
Strong revenue forecasting models do three jobs at once, they match the policy mechanism, they survive validation, and they stay usable inside government workflows. The next step is usually a three-phase rollout, pilot on a narrow revenue base, train the people who will manage the assumptions, then scale to other districts or tax streams once the process is stable.
A model's effectiveness is not determined by its outward complexity. It's whether the forecast is transparent enough for budget officers, defensible enough for auditors, and flexible enough to adapt when land markets shift. That's the standard public finance teams should hold themselves to, especially when land-value capture is meant to fund visible public improvements.
A CTA for Unitism®.