Compare property tax by state with 2024 effective rates, per-capita revenue and real household costs, plus how land-value taxes would change the picture.
November 7, 2026
Property Tax by State: Effective Rates and What They Mean
Compare property tax by state with 2024 effective rates, per-capita revenue and real household costs, plus how land-value taxes would change the picture.

More than six times. New Jersey's effective property-tax rate for owner-occupied housing was 1.88% in 2024, compared with 0.29% in Hawaii, according to the Tax Foundation's state and county comparison. That difference shows why property tax rates by state are worth comparing, but it does not identify which state would give a particular household the lowest bill.
A useful comparison separates effective rates, individual bills, and local revenue dependence. Home values and assessment rules shape what households pay. Local budgets show how much governments rely on property-tax revenue, while a land-value tax would change which property value is taxed: the land itself rather than buildings or improvements.
Table of Contents
- Effective Property Tax Rates by State in 2024
- How a Property Tax Bill Is Calculated
- Why a Low Rate Can Still Cost More
- Property Tax Revenue by State and Its Role in Local Budgets
- Affordability Beyond the Tax Rate
- Land Leases, Land-Use Rights and Land-Value Taxes Compared
- Choose the Right Comparison for Your Situation
Effective Property Tax Rates by State in 2024
The effective property-tax rate measures actual property taxes paid divided by owner-occupied home value. The following highest and lowest state averages come from the Tax Foundation's 2024 effective-rate comparison.
Effective property tax rates by state, 2024
| State | Effective rate (2024) | Position |
|---|---|---|
| New Jersey | 1.88% | Highest |
| Illinois | 1.88% | Highest |
| Connecticut | 1.54% | High |
| Vermont | 1.51% | High |
| New Hampshire | 1.50% | High |
| Hawaii | 0.29% | Lowest |
| Alabama | 0.37% | Lowest |
| Arizona | 0.48% | Low |
| Utah | 0.48% | Low |
| South Carolina | 0.49% | Low |
These are state averages, not quotes for individual properties. They exclude taxes paid by businesses and the indirect housing costs renters bear through rent, and they don't show county or municipal variation. The displayed rates put New Jersey at more than six times Hawaii's rate, but that comparison describes the share of housing value paid, not the difference between particular households' bills.
Effective rates are more useful than nominal millage rates because they incorporate the results of assessment practices, exemptions, and credits. A statutory rate alone doesn't show how much property value enters the taxable base.
What the ranking can establish
The table identifies places where owner-occupied housing bears a relatively large or small property-tax charge compared with its value. It doesn't establish whether a state's entire tax system is expensive, whether public services are adequate, or whether a particular home is affordable.
For policy analysis, a low effective rate also doesn't establish that land has little revenue potential. Valuable locations can coexist with low property-tax rates, while high-rate states may assign more public-service responsibilities to local governments.
Comparison rule: Match the measure to the question. A rate describes a burden relative to property value; a bill describes the cash payment.
Find your state if it appears among these groups, then compare it with a neighboring state that shares your housing market. A nearby comparison helps you investigate differences in assessments, services, and local levies without treating the national average as the only useful benchmark.
How a Property Tax Bill Is Calculated
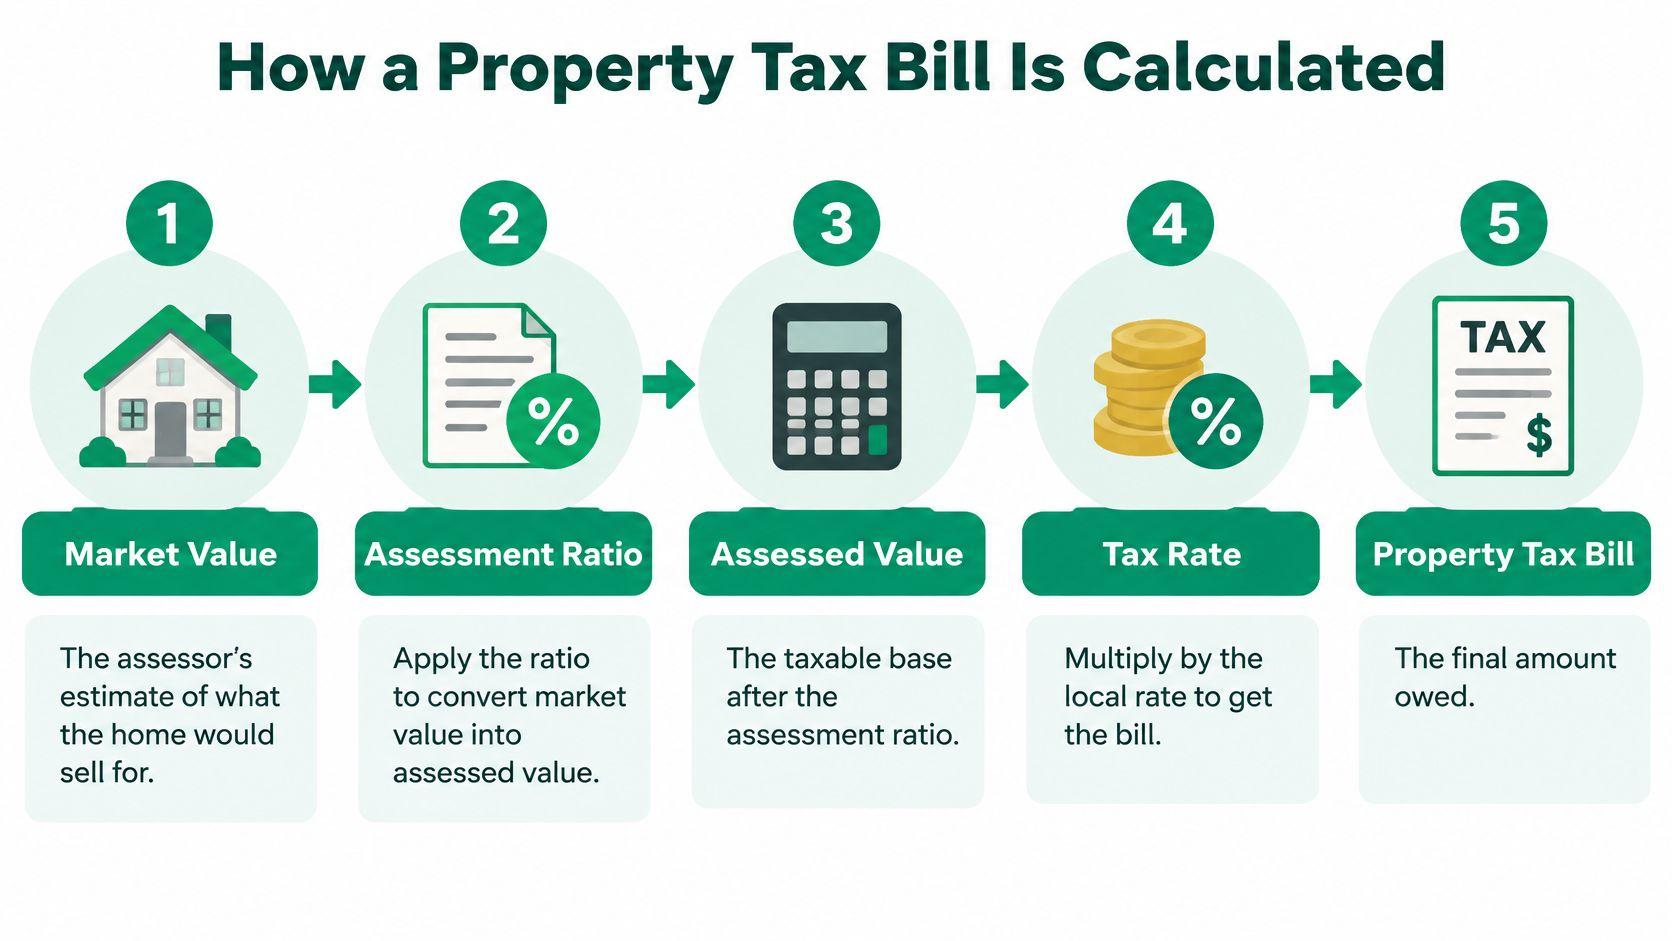
The basic formula is taxable assessed value × combined local tax rate, minus applicable credits. Assessment caps can affect the value entering that calculation, while other limits can constrain the levy or final bill.
Rebuild the calculation from your notice
-
Start with market value. Find the assessor's estimate of what your home would sell for. Check the property description as well as the valuation, because an incorrect building area or property classification can affect the assessment.
-
Apply the assessment ratio. This converts market value into assessed value. Don't assume the jurisdiction taxes the full estimated selling price.
-
Subtract eligible exemptions. Homestead, senior, veteran, and disabled-veteran exemptions can reduce taxable value where available. Confirm eligibility and whether an exemption applies to every levy on your bill.
-
Apply the combined millage rate. A mill represents a dollar of tax per thousand dollars of taxable value. County, city, school, and special-district levies can appear together, so inspect each line rather than relying only on the total.
-
Account for credits and caps. Follow the jurisdiction's calculation order, since an assessment cap changes the base rather than subtracting money afterward. Check that approved relief appears on the notice.
For a hypothetical example, take a $400,000 home assessed at 50% of market value, with a $50,000 exemption and a combined 20-mill rate. Assessed value is $200,000, taxable value is $150,000, and the resulting bill is $3,000, equivalent to an effective rate of 0.75%.
Because several taxing authorities can contribute to the bill, homes within the same state needn't face identical charges. Different district boundaries can matter even when properties have similar market values.
Use your assessment notice and tax statement to perform the calculation, then divide the annual bill by market value to obtain your own effective rate. If the amount changed, distinguish the assessment movement from the rate movement; understanding whether property tax increases every year helps you identify which part needs investigation.
Why a Low Rate Can Still Cost More
A state's effective property-tax rate is an average, not a household's bill. Because the rate compares taxes with property value, a low-rate state can still be costly for a household with an expensive home.
State averages also leave out differences in assessment rules and tax relief. A property's taxable value may reflect its assessment history and eligibility for exemptions, so its bill may not move in line with the state's rate ranking.
Similar homes can carry different burdens
- A long-term owner may have an assessed value below current market value because of a cap. That protection depends on assessment history, not necessarily on the owner's ability to pay.
- A recent buyer should check whether a sale triggers reassessment. Local rules can change the taxable assessment after a purchase.
- A renter may bear some property-tax costs through rent. An owner-occupied rate table does not show that indirect burden.
- An investor may face different exemptions or assessment rules from an owner-occupant. Occupancy classification can affect the bill.
A high annual payment does not, by itself, show what drove the cost. To examine why property taxes are high in Texas, for example, distinguish the assessed value from the combined local levy rather than relying on a state label alone.
Compare the assessed value with market value, check applicable caps and exemptions, and identify whether a bill change came from reassessment or a levy increase. These checks make a state-level comparison more useful for a specific property.
Property Tax Revenue by State and Its Role in Local Budgets
U.S. local governments collected about $661.9 billion in property taxes in 2023, or $1,965 per person. Property taxes made up 28.6% of local general revenue and 2.8% of personal income, according to the Lincoln Institute of Land Policy's local government finance summary.
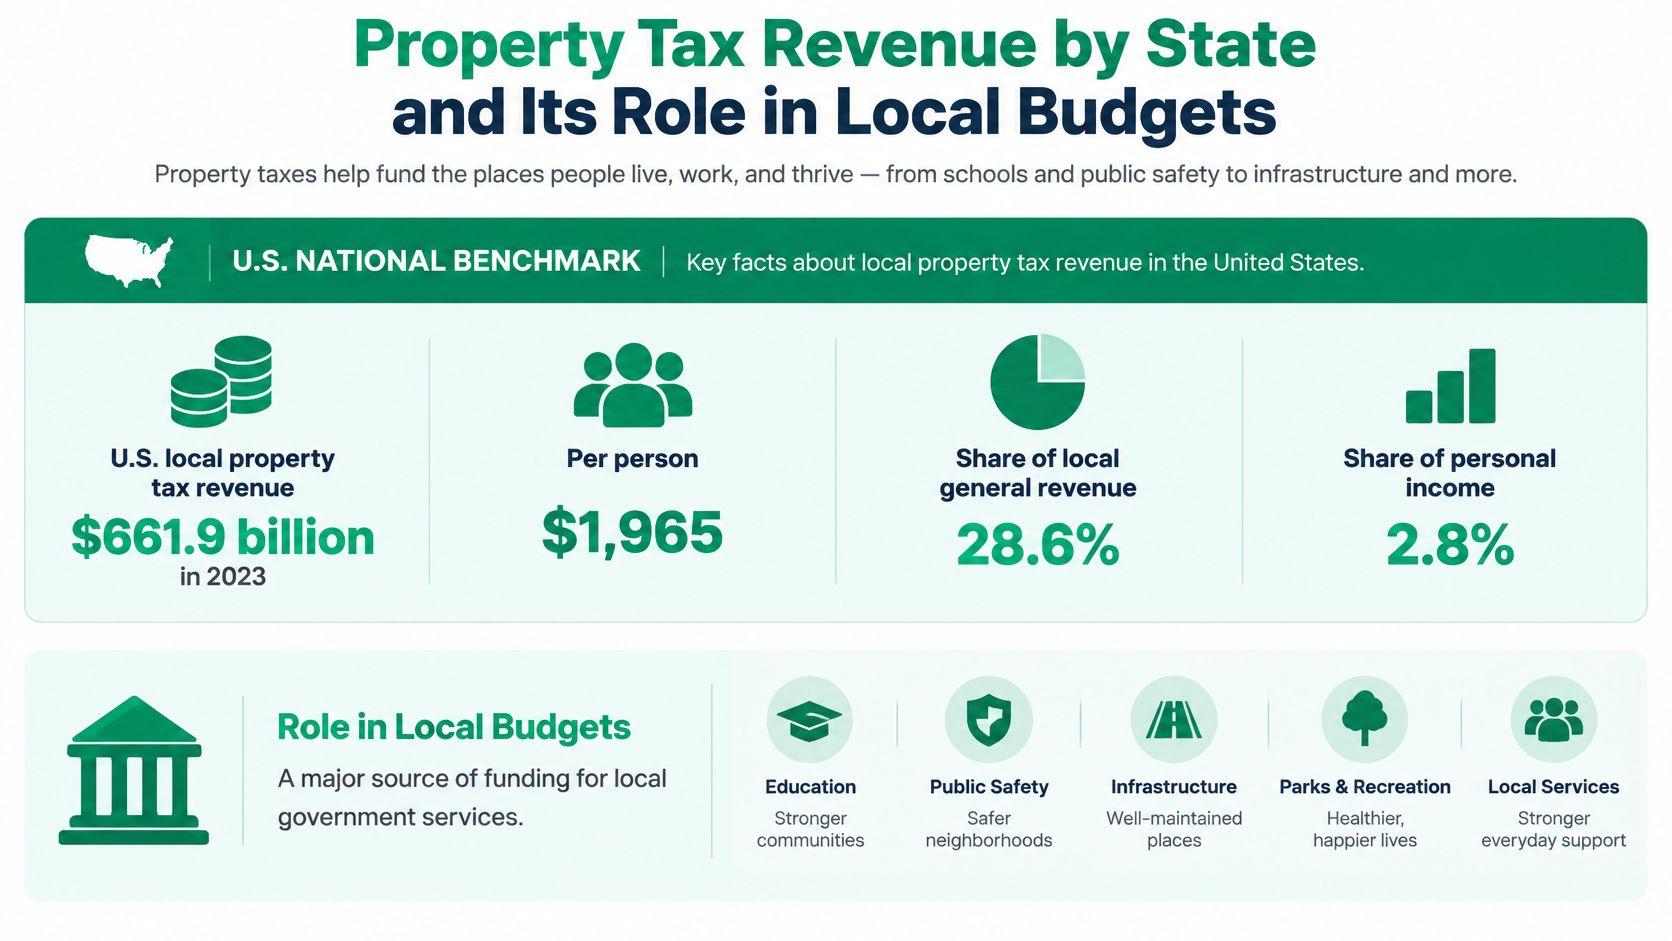
The figures below come from the Lincoln Institute's 2023 state revenue workbook. Per-person collections show revenue relative to population; the revenue share shows how much local governments rely on property tax.
Property tax revenue per person and share of general revenue, 2023
| State | Property tax per person (2023) | Share of general revenue |
|---|---|---|
| United States (local total) | $1,965 | 28.6% |
| New York | $3,454 | 30.4% |
| Connecticut | $3,299 | 60.8% |
| Massachusetts | $2,994 | 48.4% |
Revenue yield isn't revenue dependence
New York collected more property tax per person than Connecticut, while Connecticut relied more heavily on the tax as a share of general revenue. These measures answer different questions: one compares collections with population, the other compares them with all local general revenue.
Neither measure is an average homeowner bill. Per-person totals reflect a broader property-tax base than owner-occupied housing alone, and revenue shares describe government budgets rather than individual costs.
A reform's fiscal test is whether local governments can maintain services with a different revenue base. Transfers between levels of government and school-funding arrangements can affect which jurisdictions need replacement revenue. A review of municipal revenue sources helps clarify how local budgets are funded.
For an owner-side explanation of how property taxes relate to public services, see this property tax guide for real estate investors. To assess the budget impact of a change, compare collections per person, reliance on property tax, and which governments receive the proceeds.
Statewide totals can conceal local differences. Identify the counties, municipalities, and school districts that would be affected; a revenue-neutral change at the state level may still require transfers or transition arrangements to protect individual local budgets.
Affordability Beyond the Tax Rate
Property-tax delinquencies increased 5.1% in 2025, while property taxes rose sharply over a five-year period in states including Colorado, Georgia, and Florida, according to the National Housing Conference's discussion of rising housing costs. That finding directs attention to payment capacity, not just property wealth.
An owner can become house rich and cash poor when the home's estimated value rises but household income doesn't. Older owners and low-income households can face a larger recurring obligation without receiving additional cash to pay it.
Measure the recurring cash commitment
Property tax is only part of the cash-flow problem. Insurance premiums also require payment, and a mortgage servicer may collect both expenses through escrow.
When actual charges exceed the amount previously collected, the servicer may require payments that cover both the new expense and an escrow shortage. An owner should therefore separate the ongoing tax obligation from the temporary catch-up payment rather than interpreting the entire mortgage-payment increase as a new tax rate.
Use this affordability measure:
Household cash-flow check: Compare annual property tax plus annual insurance with annual household income. Keep purchase expenses, such as closing and transfer fees, separate.
This measure doesn't capture every housing cost, but it exposes pressure that a property-value denominator can conceal. Pair it with housing affordability data when evaluating whether local workers can remain housed.
For municipalities, delinquency deserves attention before households reach enforcement proceedings. Losing a home can also mean leaving the community where someone works, so a housing-cost problem can become a workforce-retention problem.
Check relief and local rules
- Payment arrangements: Ask the local tax collector whether installment plans exist, when enrollment closes, and what interest or penalties remain.
- Income-sensitive relief: Check eligibility for deferrals, freezes, or other assistance for older homeowners and households with limited income.
- Escrow administration: Request the servicer's escrow analysis and reconcile its projected charges with the actual tax statement and insurance renewal.
- Vacant and underused land: Determine how local rules treat these sites and whether their owners face different charges or classifications.
Relief should be evaluated alongside service funding. A payment deferral changes timing, while an exemption changes liability; households and budget analysts shouldn't treat them as the same intervention.
Land Leases, Land-Use Rights and Land-Value Taxes Compared
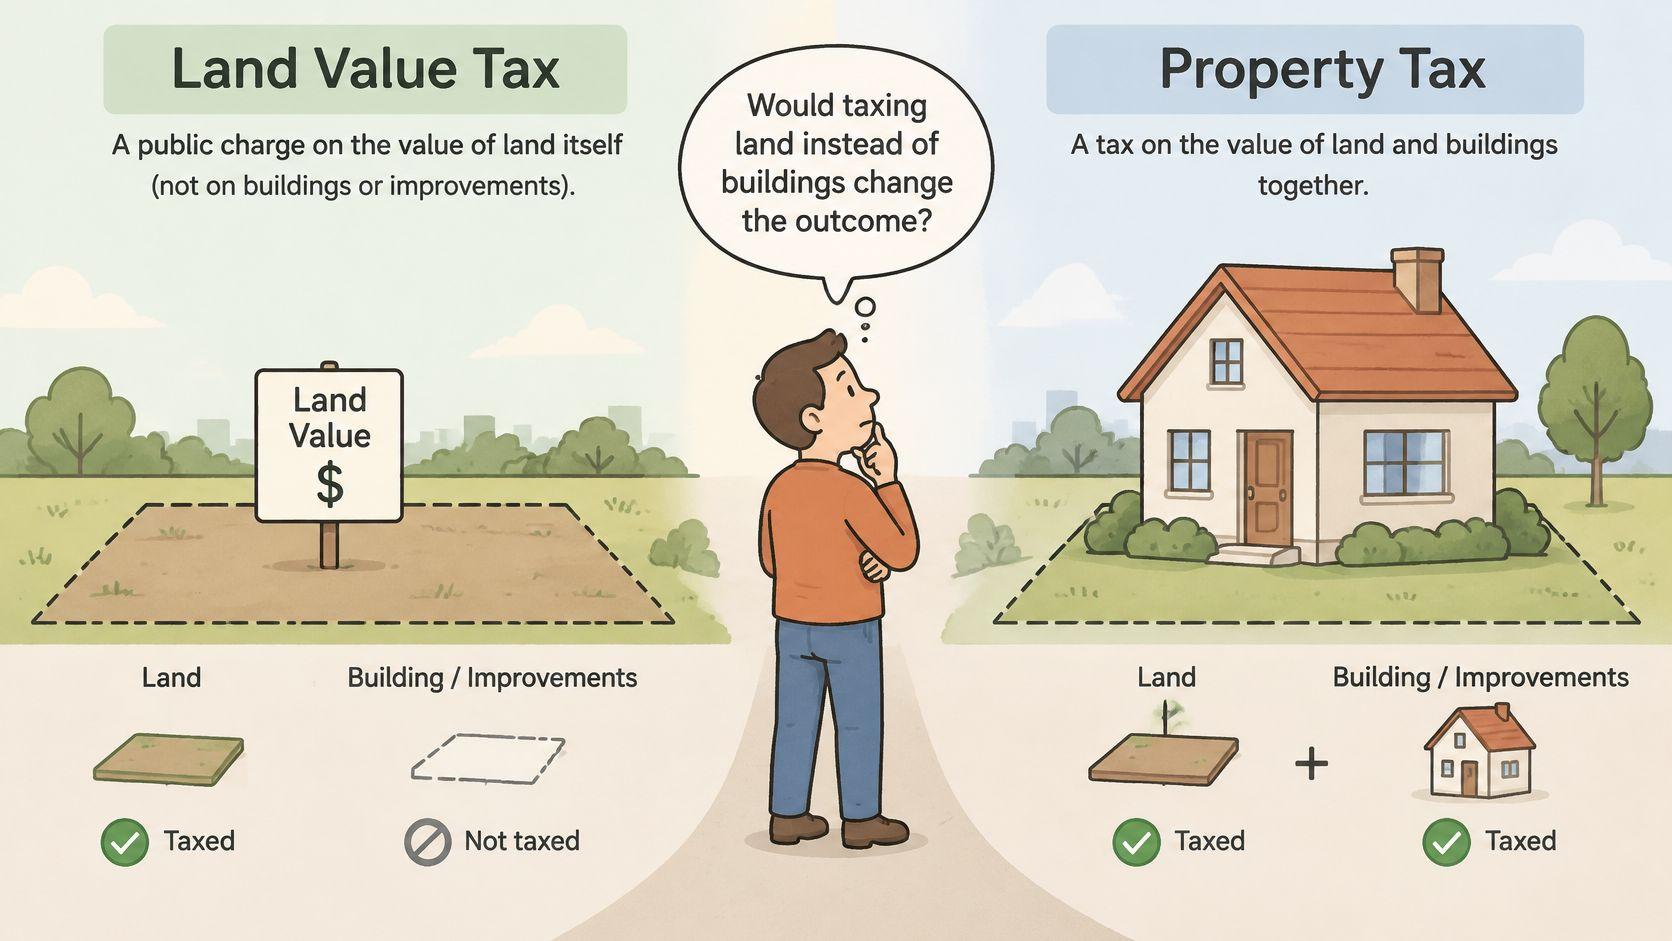
Would taxing land rather than buildings change the outcome? Land-value taxation is a public charge on the value of land itself, not buildings or improvements, with the revenue returned to the community.
A location's value comes from nearby people, roads, schools, and businesses. Collecting that location value for public purposes changes what government charges without charging an owner more for constructing a better building.
Separate taxation from tenure
A tax defines a public payment obligation. A lease or land-use right defines the terms under which someone occupies land, so these arrangements aren't interchangeable.
For this comparison, land leases are renewable or non-renewable fixed-term agreements with a fixed price. Land-use rights are indefinite, require no renewal, and are repriced annually.
Fixed-term leases compared with land-use rights
| Feature | Fixed-term lease | Land-use right |
|---|---|---|
| Term | Fixed, with an expiration or renewal date | Indefinite, with no expiration |
| Renewal | Required at the end of a renewable lease; unavailable on a non-renewable lease | Not required |
| Repricing | Fixed price until renegotiation | Repriced each year |
| End-of-term correction | Accumulated gap closed in one large repricing for a renewable lease | None; the price tracks each year |
| Resale and refinancing | Harder as expiration approaches, particularly without renewal | Easier to buy and sell at low cost under this design |
A renewable fixed lease offers payment certainty only until its term ends. At renewal, the accumulated gap between the contractual payment and market rent can close through a major repricing. A non-renewable lease becomes progressively harder to refinance and sell as the remaining period of occupancy shortens.
Fixed leases postpone land-price risk rather than price it continuously. Annual repricing instead brings the payment into line with current site rental value, although occupants must still budget for annual changes.
Apply the tenure tests precisely
Call an arrangement a land-use right under this definition only if it meets all these conditions:
- Annual repricing: The payment is updated each year.
- No renewal: Continued occupation doesn't require a new term.
- No expiration: The right is indefinite.
A fixed lease sometimes carries the label land-use right, but it remains a fixed lease if it fails any test. Under the indefinite, annually repriced design, transfers can occur at low cost without negotiating a new fixed term; that describes the institutional model, not a verified outcome in a particular jurisdiction.
Traditional property taxation can charge both land and buildings. A land-value tax instead charges site value regardless of the owner's improvements, reducing the penalty on construction and productive enterprise while making idle-site holding costly.
Collecting land rent rewards good use and makes speculation based solely on retaining community-created rental gains unprofitable when those gains are fully collected. Land also cannot be hidden, moved abroad, or smuggled out, making it an unusually transparent public revenue base. Appropriate valuation and transition design remain necessary; changing the base doesn't remove the need to model household payments.
Choose the Right Comparison for Your Situation
The right comparison depends on who is asking. A buyer needs a credible prospective bill, while a finance official needs a credible revenue forecast. Neither should substitute a state ranking for the measure that answers their decision.
Households need property-specific information
For a home buyer, use the expected bill after applicable exemptions and divide it by market value. Obtain the assessment record, identify the taxing districts, and investigate how a sale affects eligibility or assessed value before treating the seller's payment as your own forecast.
Compare homes using the same assumptions about occupancy and relief. Otherwise, you may mistake a difference in the current owner's eligibility for a permanent advantage attached to the property.
For a renter, investigate property tax as a component of housing costs, not as a separately observable homeowner rate. If the property's tax bill is available, compare it with rental revenue to understand the owner's expense exposure, but don't assume every tax increase passes through dollar for dollar. Ask whether the local levy is rising and how the lease handles cost changes.
Public decisions need linked fiscal and household models
For a local official or planner, compare per-person collections with the share of general revenue supplied by property tax. Then model a land-based alternative parcel by parcel, accounting for the receiving government, assessment quality, relief provisions, and transition arrangements.
Aggregate revenue neutrality isn't enough. A proposal can preserve total receipts while changing which households pay and which municipalities receive the money.
For a researcher or housing agency, combine effective rates with household-income measures, insurance costs, tenure, and assessment history. Separate owner-occupied housing from rental and commercial property so that an average calculated for one group doesn't become a claim about another.
Unitism® works with governments, cities, and organizations on putting its land-value approach into practice. Our support includes assessing land values, designing policies that collect them, and modeling who gains and who pays.
Before acting on any property tax by state comparison, complete this checklist:
- Choose the relevant number: Use a household bill for a purchase decision, recurring costs relative to income for affordability, and revenue measures for fiscal policy.
- Verify property-level treatment: Confirm the applicable cap, exemption, classification, and taxing districts using the assessment notice and local rules.
- Recheck after reassessment: Rebuild the calculation when a new notice arrives, and investigate discrepancies before the appeal deadline.
Unitism® offers land-valuation frameworks, fiscal and distributional modeling, and transition design to help governments evaluate property-tax reform without overlooking local services or household burdens. Visit Unitism® to explore support for comparing the existing tax base with a land-based approach and planning its implementation.