Housing affordability data guide: key indicators, datasets, APIs, calculation steps and methodology limits for policy modeling and visualization.
October 30, 2026
Housing Affordability Data: Indicators, Sources and Methods
Housing affordability data guide: key indicators, datasets, APIs, calculation steps and methodology limits for policy modeling and visualization.

In the United States, inflation-adjusted median rents rose 21% between 2001 and 2022, while median renter household incomes rose just 2%, according to the National Low Income Housing Coalition's summary of the latest State of the Nation's Housing report. That gap reframes housing affordability: the problem isn't only what a home costs today, but how housing costs move against household resources, and what the combined figures fail to reveal.
A useful measure must answer two questions. How much does housing cost relative to income, and can households still meet essential expenses and withstand a shock? To answer them well, analysts also need to distinguish the value of a building from the value of its location. A single ratio can show pressure without explaining its source or whether households can cope.
Table of Contents
- What Housing Affordability Data Measures
- Core Indicators at a Glance
- How to Calculate Price-to-Income and Rent-to-Income Ratios
- Rent Burden and Residual Income Measures
- Supply and Land Value Indicators Few Datasets Publish
- Land Value Tax, Leases and Land-Use Rights Compared
- Where to Find Housing Affordability Datasets and APIs
- Limits and Methodology Pitfalls in Affordability Data
- Choosing and Visualizing Indicators
What Housing Affordability Data Measures
Housing affordability data describes the relationship between household resources and the cost of shelter. That sounds straightforward, but no single measure captures the purchase price, monthly housing outlay, and capacity to pay for everything else. The right indicator depends on the question being asked.
Three lenses are particularly useful:
- Price: What does buying a home cost relative to household income? This can show how purchase prices compare with earnings, but it won't by itself reveal financing terms or how much of the price comes from land.
- Rent: What share of income goes to rent and related housing expenses? A rent ratio describes the weight of housing costs, but not what a household has left after paying them.
- Residual capacity: What remains after housing and other essential expenses? This lens asks whether the household can cover necessities and keep a buffer, rather than treating every household with the same housing-cost share as equally secure.
The measures draw on different kinds of evidence. Census and household surveys report income, housing costs, and household characteristics. National statistics offices publish comparable indicators for their jurisdictions. Mortgage and rental market data track prices and payments, while permit records help analysts examine new construction. These sources differ in geography, update frequency, and definitions, so combining them takes care.
For example, a metro where home prices rise far faster than incomes may face a different affordability problem from one where rents rise while wages stay flat. A price-to-income ratio may identify the first pattern, while rent and income measures are needed to describe the second. Either way, a matching ratio can conceal differences in financing, household expenses, and land values. This overview of the housing affordability crisis gives readers another way to frame why the underlying mechanisms matter.
The useful sequence is to define each indicator, calculate it consistently, compare rent burden with residual income, examine supply and land measures, distinguish tenure and land charges, and choose sources with their limits in mind. Before modeling, make sure the measures fit the question rather than letting the easiest available number set the agenda.
Core Indicators at a Glance
| Indicator | Definition or formula | Common threshold | Usual source |
|---|---|---|---|
| Price-to-income ratio | Median house price divided by median household income | About 3 is often cited as affordable; above 5 is stressed | Census, national statistics offices |
| Rent-to-income ratio | Median gross rent divided by median household income | 30% of income | Census surveys, housing surveys |
| Housing cost overburden | Share of households spending over 40% of disposable income on housing | 40% (OECD threshold) | OECD, Eurostat |
| Severe cost burden | Share of households spending over 50% of income on housing | 50% of income | Housing agency reports, census microdata |
| Residual income | Income left after housing and essential costs | No universal percentage threshold; assess remaining resources against essential costs | Household expenditure surveys |
| Mortgage payment-to-income | Monthly mortgage payment divided by gross monthly income | No single universal threshold; state the lender's convention | Lender data, mortgage market statistics |
| Supply indicators | Building permits, completions and vacancy rates | No common affordability cutoff; compare direction and local need | Permit registers, vacancy surveys |
Each row answers a different question. Price-to-income asks how large a home's price is relative to earnings; it doesn't say how much a buyer must borrow or whether the price reflects a costly building or scarce location. Rent-to-income measures rent's share of income, while housing cost overburden applies a specified share of disposable income to a broader bundle of housing costs. The OECD identifies spending more than 40% of disposable income on rent or mortgage payments, maintenance, and utilities as overburden. The OECD's affordable housing overview explains that affordability is measured through housing costs relative to disposable income, as well as through prices.
Severe cost burden flags households spending more than half their income on housing. It identifies an acute level of pressure, but still doesn't tell you what remains for food, transport, or care. Residual income gets closer to that question by subtracting housing and essential expenses from income. A mortgage payment-to-income ratio compares the monthly payment with gross monthly income, but the result depends on the payment definition and income convention. Permits, completions, and vacancy rates indicate construction activity and use of the existing stock, not affordability by themselves.
Comparison rule: Thresholds are conventions, not universal laws. Confirm the definition, income measure, and cost bundle used by each report before comparing places or years. A primer on quality-of-life measurement can also help clarify which outcomes a chosen measure is meant to represent.
A ratio tells you the level of pressure. A supply indicator helps investigate possible causes, but neither alone separates a building's construction cost from the value of its land and location.
How to Calculate Price-to-Income and Rent-to-Income Ratios
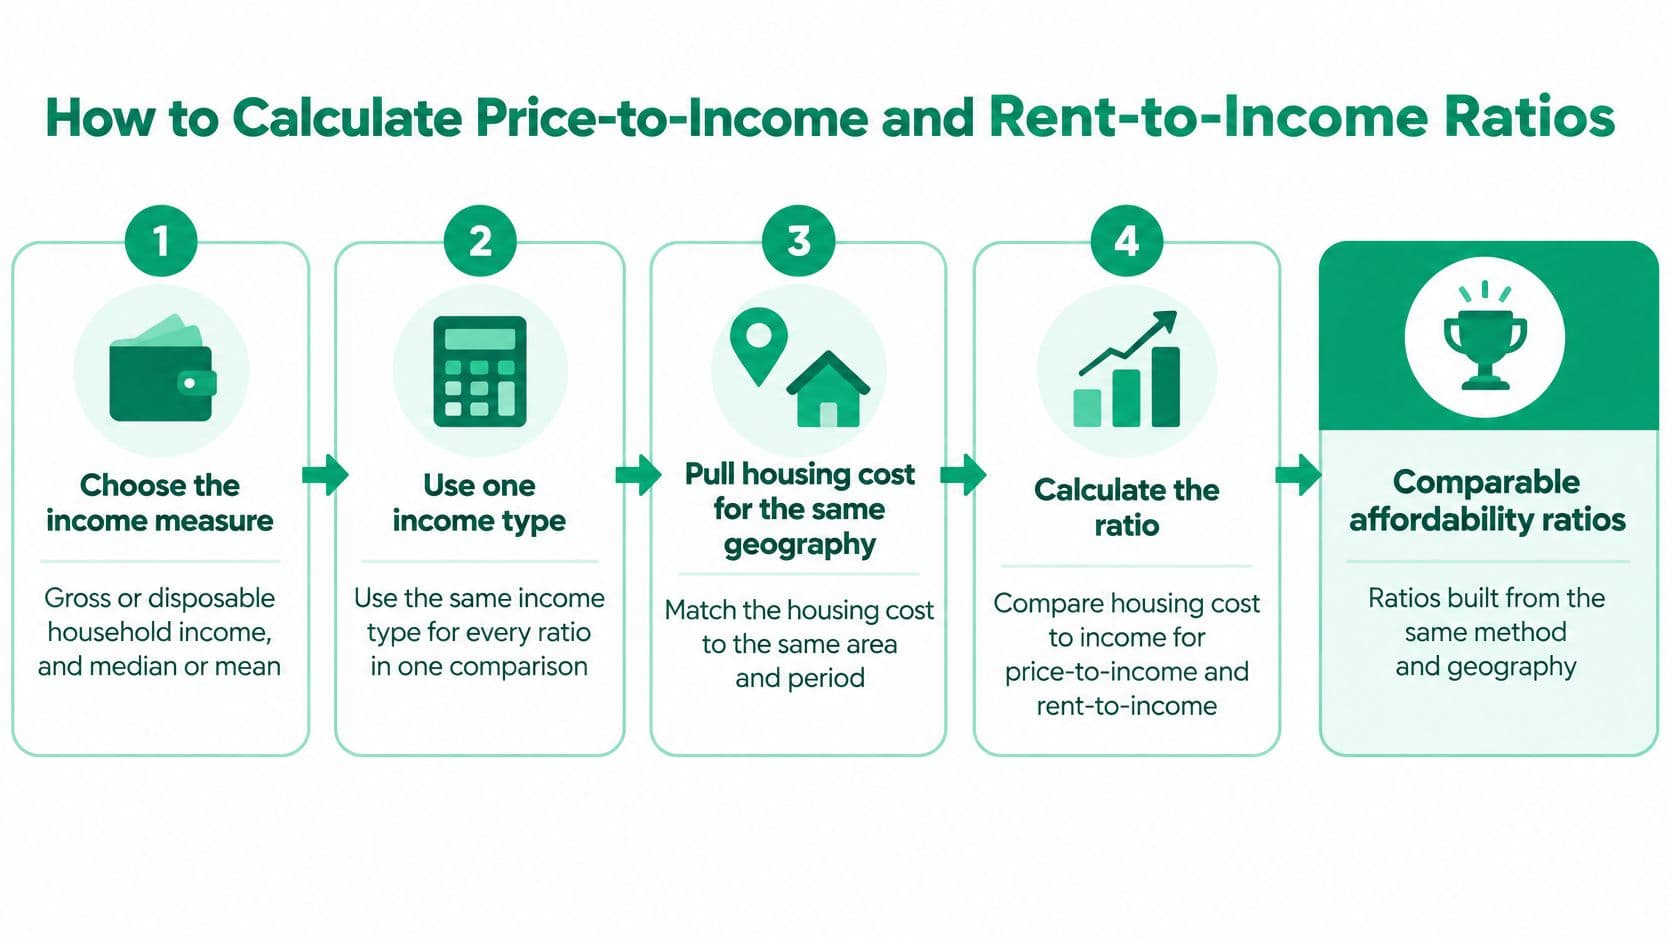
A ratio is only comparable when its inputs match. Use this sequence to calculate it and document the choices that shape the result.
-
Choose the income measure. Decide whether the calculation uses gross or disposable household income, and whether it uses the median or mean. Keep the same income type throughout a comparison, because switching definitions can change the apparent level of affordability.
-
Match geography and period. Use the sale price or rent for the same area and year as the income figure. A metro-wide housing cost divided by income for a smaller city or a different period can produce a tidy number that answers the wrong question.
-
Put housing cost and income on the same time basis. For a rent ratio using annual income, multiply monthly rent by 12, then divide by annual income. For a price-to-income ratio, divide the median sale price by median annual household income.
Worked example: A median price of 400,000 divided by median household income of 100,000 gives a price-to-income ratio of 4.0. Monthly rent of 1,800 multiplied by 12 gives annual rent of 21,600; divided by annual income of 72,000, that produces a rent-to-income ratio of 30%.
-
Compare like with like. Read the result against the relevant convention: price-to-income benchmarks, the commonly used 30% rent share, or the OECD's 40% of disposable income overburden threshold. That OECD threshold includes rent or mortgage payments, maintenance, and utilities, so it isn't interchangeable with a rent-only ratio.
-
Test the conclusion with another measure. Pair the ratio with residual income or a supply indicator before calling an area affordable or unaffordable. The OECD housing affordability overview reports that roughly one in three low-income tenant households across OECD countries exceeds the 40% overburden threshold, illustrating why income group and tenure matter alongside a headline ratio.
The most consequential calculation error is mixing gross and disposable income in one comparison. Record the income definition, geography, year, and cost components with every result so another analyst can reproduce it. For readers comparing local purchase markets, a resource on Destin home prices can provide local context, but a market price still needs to be paired with a matching income measure before it becomes an affordability ratio.
Rent Burden and Residual Income Measures
A household earns 3,000 per month and pays 1,200 in rent, 300 in utilities, 400 for transport, 500 for childcare, and 600 for food. The rent is 40% of take-home pay, above the commonly used 30% rent threshold, yet after these listed costs nothing remains as a buffer. The ratio identifies a heavy rent share; the residual calculation shows why the household has no room for an unexpected expense.
Residual income means what remains after housing and essential costs. Analysts may include rent, utilities, transport, childcare, debt payments, and food, but they should state exactly which costs they subtract. Two studies can label a measure “residual income” while producing different results if one excludes transport or debt.
The same burden share can also mean different things for different households. A household with multiple earners, fewer dependants, or lower transport costs may have more flexibility than a household with one earner and substantial care expenses. Location matters too: two households with the same rent share can face different costs for getting to work or accessing services. A ratio cannot reveal those differences unless the analysis includes household type and other expenses.
What the burden share leaves out
Burden measures are commonly reported by income band. That breakdown helps show how pressure is distributed, rather than implying that a national average describes every renter. The OECD's affordability figures show that roughly one in three low-income tenant households across its member countries spends more than 40% of disposable income on housing costs, compared with about one-quarter of low-income mortgaged homeowners, as reported in its affordable housing overview.
Those figures measure overburden, not the full cost of living or a household's remaining resources. They should be interpreted with care: a threshold share can classify a household as burdened, but it can't reveal how much money remains after necessities or how income varies from month to month.
Building a residual measure
Household expenditure surveys can support residual-income estimates by pairing income with housing and essential spending. Analysts typically need access to household-level microdata, consistent spending categories, and a method for accounting for household size. Equivalence scales can help compare households with different compositions, but the chosen scale needs to be documented because it changes how resources are interpreted.
Publish burden shares and residual income side by side. Label the income band, tenure, household type, geography, and included expenses for each figure. That lets readers see both how much income goes to housing and whether the remaining budget can cover basic needs.
Supply and Land Value Indicators Few Datasets Publish
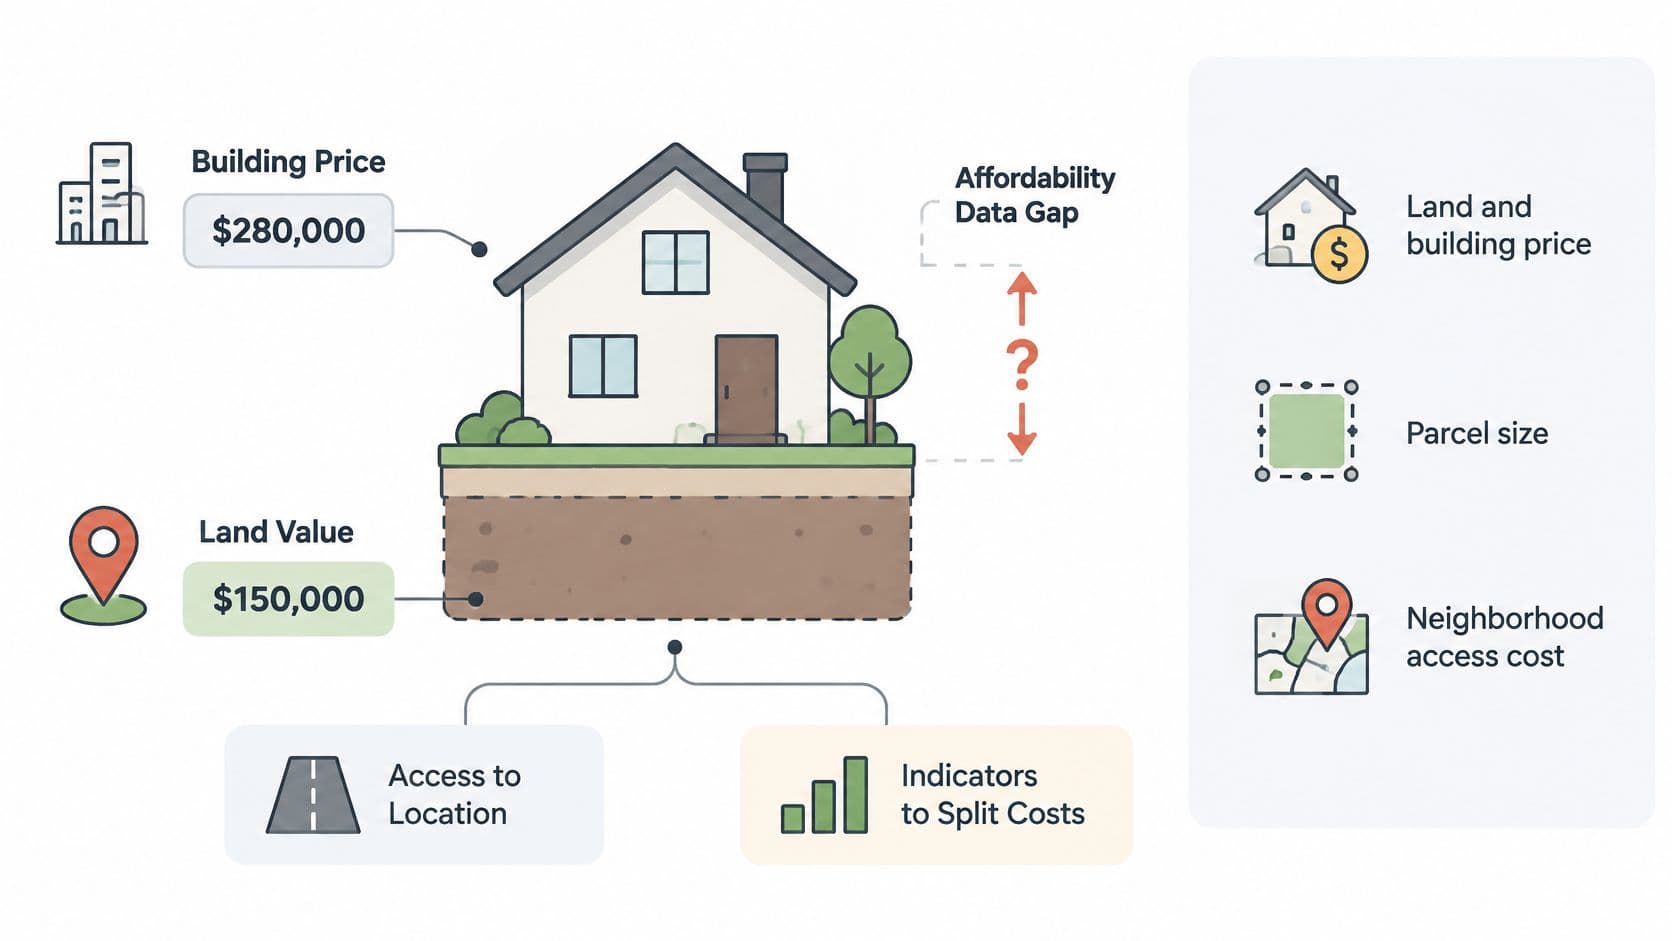
In Greater Boston, the income needed to buy an entry-level home rose from just under 98,000 in 2021 to more than 162,000 in 2025, while the monthly payment increased from about 2,520 to over 4,200, according to JPMorgan's housing affordability analysis. Those figures show a sharp change in purchase affordability, but they don't identify how much came from land values, construction, interest rates, or regulatory scarcity.
That's a major blind spot. Many published measures treat the price or rent of a dwelling as one indivisible cost. To distinguish building costs from the price of access to a location, analysts need land and building price decompositions and site-value gradients across a city. They also need vacancy and underuse measures, permitted-versus-built housing capacity, and information about how taxes treat land compared with improvements.
What to look for in local datasets
Assessor land-value rolls can help estimate the site component of property values, while building permit registers show approved construction activity. Vacancy surveys help indicate whether existing dwellings are occupied or underused. No one dataset answers the whole question: analysts must align records, definitions, and geography before treating them as a coherent picture.
This separation matters for policy. If the price increase comes mainly from construction inputs, reducing building costs may address part of it. If location value is being capitalized into sale prices and rents, cheaper construction alone may not resolve the affordability problem. When land cannot be hoarded for speculation, homes cost closer to what it costs to build them. The land zonal value framework offers one way to think about measuring the value of location separately from improvements.
A land-value measure can also help analysts test whether underused sites are being held out of active use, though the indicator itself doesn't establish why a site is vacant. For a stronger comparison, pair assessed values with permits, completed housing, and vacancy information, then examine how the measures change across locations.
The key question for policy analysis is direct: Can affordability improve through lower construction costs when location value continues to be capitalized into prices and rents? Without land-value and underuse indicators, a housing-cost ratio can show that homes are expensive but cannot fully diagnose the source.
Land Value Tax, Leases and Land-Use Rights Compared
| Form | Term | Price reset | Renewal needed | Expires |
|---|---|---|---|---|
| Renewable fixed-term lease | Fixed term | At renewal, potentially as one large repricing | Yes | Yes, at term end |
| Non-renewable fixed lease | Fixed term | None during the term | No | Yes, with refinancing becoming harder as the term shortens |
| Land-use right (as defined here) | Indefinite | Repriced every year | No | No |
| Land value tax | Ongoing annual charge | Annual reassessment of site value | No | Not applicable, ownership stays with holder |
A renewable fixed-term lease gives the holder certainty only until the agreed term ends. If the contract price remains below the site's current value, the difference can build up and be reflected in the price at renewal. A fixed price can therefore diverge from current site value during the lease term.
A non-renewable fixed lease creates a different risk. As the remaining term shortens, lenders and prospective buyers may be less willing to refinance or purchase the leasehold interest. The asset can become harder to finance and sell, while the fixed price may diverge from current site value. These terms can also affect investment, business transfers, and the value of improvements.
Distinguishing annual repricing from a fixed term
A land-use right, in the narrow sense used here, is indefinite, never expires, requires no renewal, and is repriced annually. It has no fixed term, so holders can buy and sell it without waiting for a lease renewal or approaching expiry. Annual repricing keeps the charge connected to land value.
Sometimes a fixed lease is called a “land-use right,” but the label does not change its terms. Unless it is repriced each year, requires no renewal, and never expires, it remains a fixed lease. Economic rent is income from owning a desirable location or natural resource, rather than income from work or investment. The distinction is between a contractual price fixed for a term and a charge that tracks the value of the right to use land each year.
A land-value tax is an annual public charge on the value of the site itself, excluding buildings and other improvements. Ownership remains with the holder; the tax does not transfer possession. Because the charge applies to site value rather than construction, it does not directly tax improvements in the way a tax on total property value does. It can also make idle or underused sites more costly to hold, although the effect depends on the tax design.
Contract test: Does the price reset every year? Is renewal required? Does the right expire? If the terms do not provide for annual repricing, no renewal, and no expiry, classify it as a fixed-term lease rather than a land-use right.
Where to Find Housing Affordability Datasets and APIs
| Source | Access route | Geography | Best use |
|---|---|---|---|
| American Community Survey (U.S. Census Bureau) | Census API and data portal | U.S. down to small areas | Local rent and income ratios |
| HUD CHAS data | Downloadable tables | U.S. by jurisdiction | Cost burden by income and household type |
| FRED (Federal Reserve Bank of St. Louis) | Series API and downloads | U.S. national and metro | Long time series |
| Eurostat housing cost overburden | Eurostat API and bulk download | EU countries | Cross-country overburden share |
| OECD Data Explorer and affordable housing topic | OECD data API and downloads | OECD countries | Comparative indicators |
| Statistics Canada tables | Web Data Service and table downloads | Canada, provinces and cities | Canadian ratios and burden shares |
Choose datasets by the question, geographic scale, and measurement method. The American Community Survey supports local rent and income comparisons. HUD's CHAS tables (Housing Affordability Strategy) organize cost burden by income and household type. FRED series and downloads support time-series analysis, while Eurostat and OECD provide cross-country indicators and Statistics Canada provides Canadian data.
Access format affects how the data can be used. APIs support repeatable queries; downloadable tables suit targeted analysis; dashboards offer a quick overview. For land and location analysis, estimating land value by address is a separate task from measuring housing costs. Keeping site value distinct from building costs helps show what affordability ratios alone cannot.
Three checks before combining data
-
Check the vintage. Record each dataset's release date and reference year. A dashboard accessed today may display data collected earlier, so the access date does not identify the period measured.
-
Match the geography. Standardize geographic codes before joining datasets. A city, metro area, province, or national boundary may represent a different housing or employment market across sources.
-
Document the method. Label figures as nominal or inflation-adjusted, and specify whether income is gross or disposable. Use dashboards for initial exploration. Microdata is more appropriate when the question depends on household income, tenure, or spending patterns.
For lending analysis, compare housing indicators for lending decisions. Keep each file's source, access route, and geographic unit with the data so the analysis can be reproduced.
Limits and Methodology Pitfalls in Affordability Data
A stable rent-to-income ratio can coexist with worsening payment trouble. In U.S. evidence summarized by the Urban Institute's analysis of renters' payment difficulties, 20.0% of working-age renters reported missing or making a late rent payment in 2025, up from 16.5% in 2024. For middle-income renters, the share rose from 14.3% to 21.6%. Federal Reserve data cited in the same analysis found 23% of renters were behind on rent at some point during 2025, while median rent remained $1,200. A ratio can look steady while household resilience deteriorates.
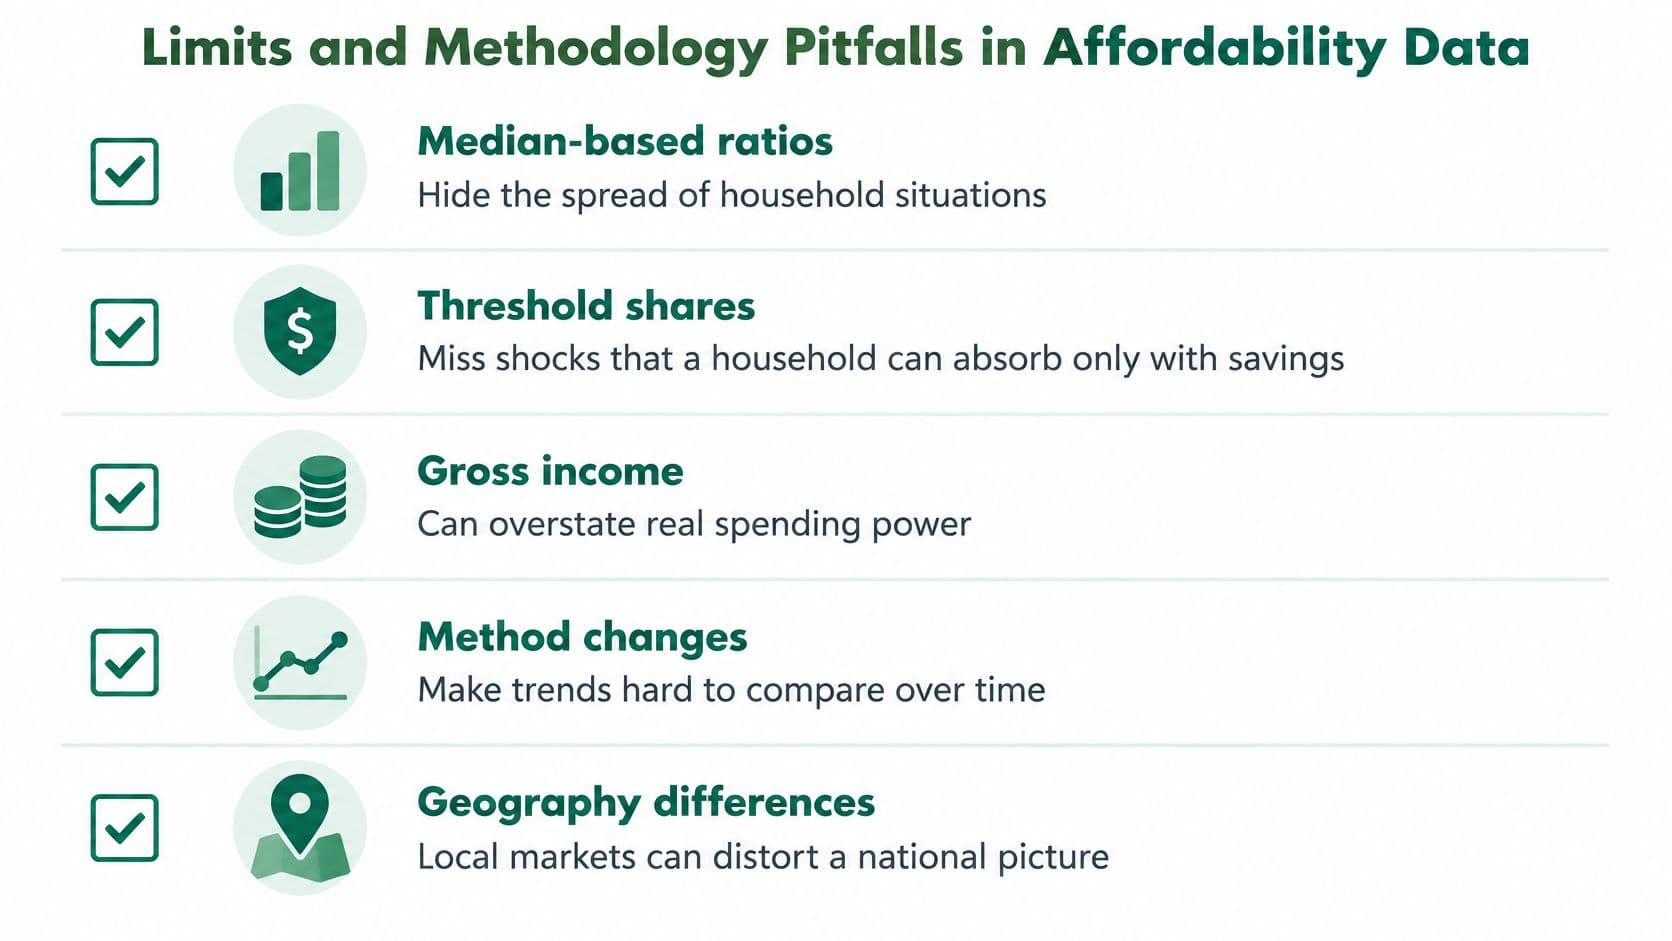
Use these reporting rules to expose what a headline number may hide:
- Median-based ratios: Report the distribution or break results out by income and tenure. A national median won't show how widely household situations differ.
- Threshold shares: Pair the share above a cost-burden cutoff with arrears or a residual-income measure. A household may sit below a threshold and still lack savings to absorb an expense or income shock.
- Income definitions: Label gross or disposable income every time. Combining different definitions can make two ratios look comparable when they aren't.
- Geography: State the boundary and explain whether it represents the market households use for housing and work. Administrative borders may not capture that market.
- Data timing: Give the reference year and release date. Published figures can describe a past period rather than present conditions.
- Tenure and definitions: Separate renters from owners where possible, and specify what counts as rent, housing costs, and a household. Cross-country definitions aren't automatically equivalent.
- Small-area samples: Flag estimates based on thin samples rather than presenting them as precise local facts.
A stronger dashboard should pair ratios with arrears, residual income, income volatility, and housing security, disaggregated by tenure and income. That combination can identify households that remain under a conventional cost-burden threshold but can't absorb a modest shock. For researchers writing up their choices, this guide to methodology chapter essentials offers useful context for making definitions and procedures explicit. Analysts comparing property assessments should also document the valuation method, as described in mass appraisal methods.
Choosing and Visualizing Indicators
Choose the measure from the question, not the other way around. If the question is whether a land-value tax change will reduce rent burden for low-income tenants, a price-to-income ratio alone won't answer it. The analysis needs indicators that track housing pressure, household resilience, and the land or supply mechanism being tested.
-
Write the question in one sentence. State the population, geography, policy, and outcome. A focused question makes it easier to identify which indicators can effectively test the claim.
-
Use at least two lenses. Pair a rent ratio with residual income or arrears, for example. The first describes housing costs relative to resources; the second tests what those costs mean for household capacity.
-
Document every convention. Record the threshold, income definition, source vintage, and geography for each measure. This makes the comparison reproducible and exposes mismatched methods before they shape the conclusion.
-
Test the mechanism. Add a supply or land-value indicator to assess whether construction costs, location value, or underused capacity could be driving the result. When land, buildings, and other productive investment are combined into one figure, the proposed policy may be aimed at the wrong component.
-
Match the chart to the question. Plot a ratio against its threshold line, show burden by income band rather than only as a national median, and display residual income beside burden. Label nominal or inflation-adjusted values on every chart, keep the same geography codes across panels, and never put a gross-income ratio and a disposable-income ratio on the same axis.
Unitism's Interactive Tools are simple models that show how land shapes the economy. Its support for clients includes assessing land values, designing policies that collect them, and modeling who gains and who pays.
Choose one indicator from the table, calculate it for one geography, and compare the result with a second source. That first cross-check will show whether the two measures agree, and which assumptions need closer attention.
Unitism® supports housing affordability analysis through land valuation, policy design, and distributional modeling that examines who gains and who pays. If your work needs to distinguish land value from building costs or test how a policy affects households, visit Unitism® to explore its research and advisory support.