A complete policy guide to transit oriented development covering principles, benefits, financing tools, governance, and metrics
September 18, 2026
Transit Oriented Development: A Complete Policy Guide
A complete policy guide to transit oriented development covering principles, benefits, financing tools, governance, and metrics
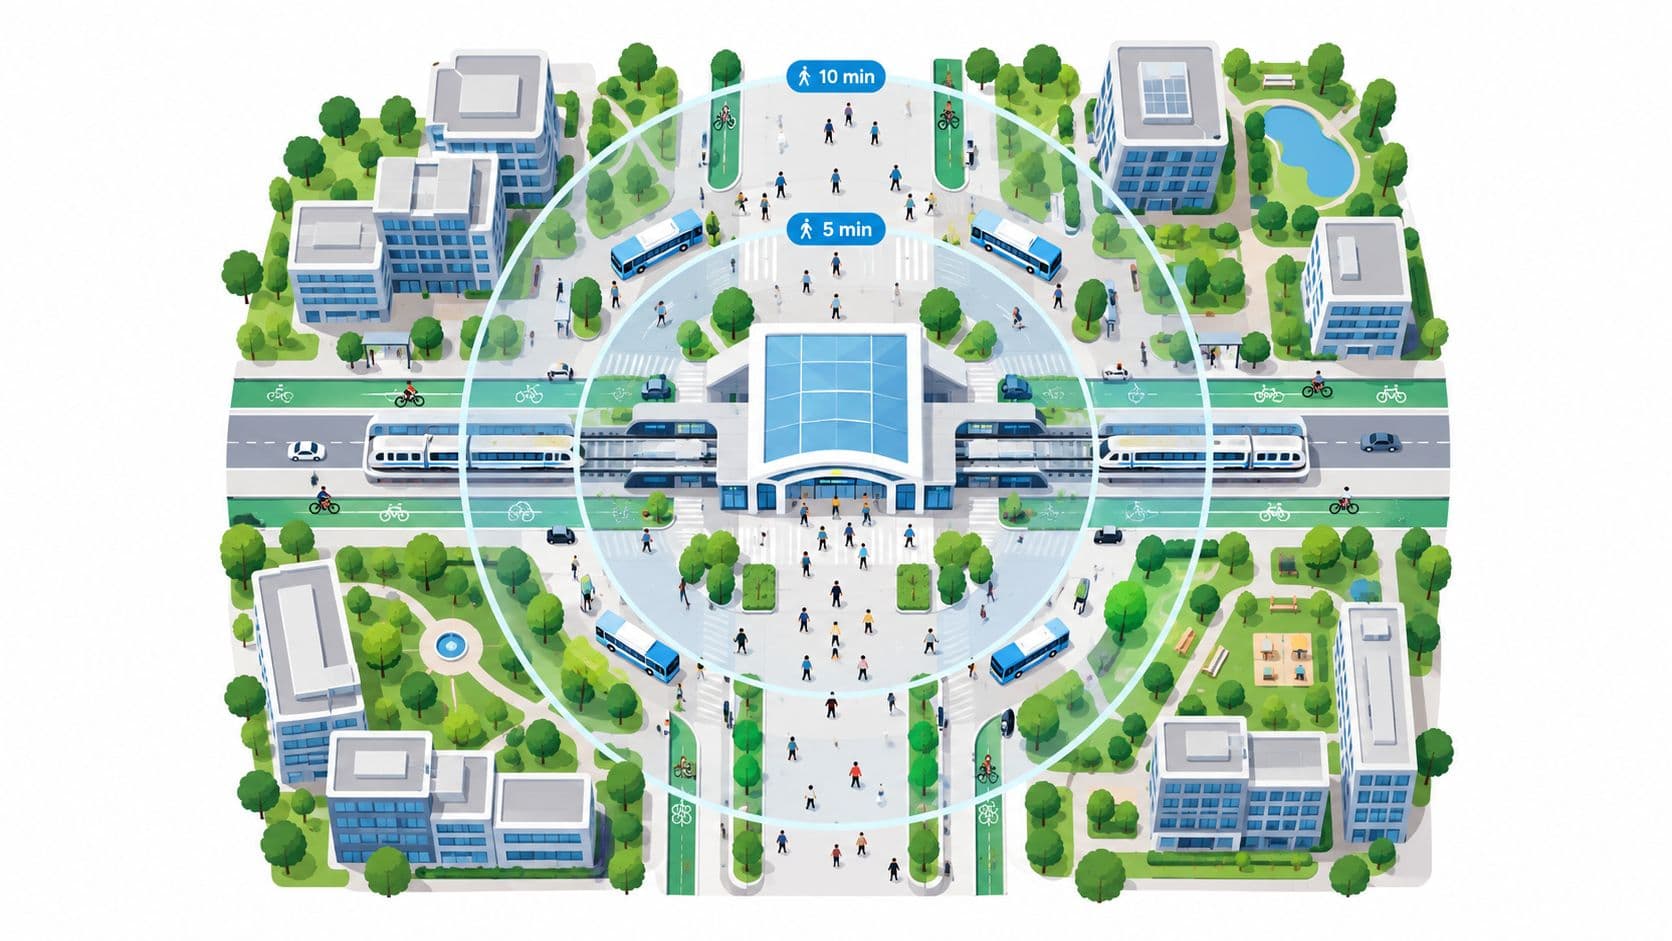
In 2022, 67 million U.S. housing units were within a half-mile of transit, equal to 45% of all housing units, yet only 10% were near frequent transit service according to the Federal Transit Administration's TOD research. That gap captures the central policy problem: proximity to a station doesn't automatically create transit oriented development, and building density near a line doesn't automatically create public value.
Functional TOD coordinates walkable access, frequent service, mixed land uses, and sufficient density. Those choices raise accessibility, which can increase the rental value of nearby land. The fiscal question follows immediately: how should a city or ministry recover part of that publicly created value without discouraging construction, enterprise, or household mobility?
The answer depends on the instrument. Site-value taxation, fixed land leases, and indefinite annually repriced land-use rights distribute risk and public revenue in different ways. A station-area strategy that ignores those differences may produce attractive buildings while leaving the public sector with the costs and the private sector with most of the uplift.
Table of Contents
- What Transit Oriented Development Actually Means
- A Brief History of Building Around Transit
- Why Cities and Ministries Invest in TOD
- Planning and Design Elements That Make TOD Work
- Financing TOD Through Site Value Capture
- Governance and Implementation Steps
- Metrics That Tell You TOD Is Actually Working
- Common Pitfalls and How to Mitigate Them
What Transit Oriented Development Actually Means
Functional transit oriented development depends on three conditions working together. First, homes, jobs, and daily services need to sit within a practical station walkshed, generally one-quarter to one-half mile, according to TRCP and FTA guidance. A half-mile is roughly 800 metres, or about a ten-minute walk. Terrain, road crossings, weather, and perceived safety can reduce the distance people will comfortably travel on foot.
Second, service must arrive often enough that riders do not have to organise daily life around a timetable. The same guidance identifies intervals of about 5 to 15 minutes as a practical range for shifting more trips from cars to transit. Apartments beside an infrequent route create a transit-adjacent district, not necessarily a transit-oriented one.
Third, the station area needs enough activity to support that service. A planning review reports that ridership gains become most significant above roughly 45 to 50 activity units per gross acre, although the relationship changes with transport mode, frequency, and land-use mix. The benchmark, discussed in PSRC TOD guidance, should guide local assessment rather than serve as a universal rule.
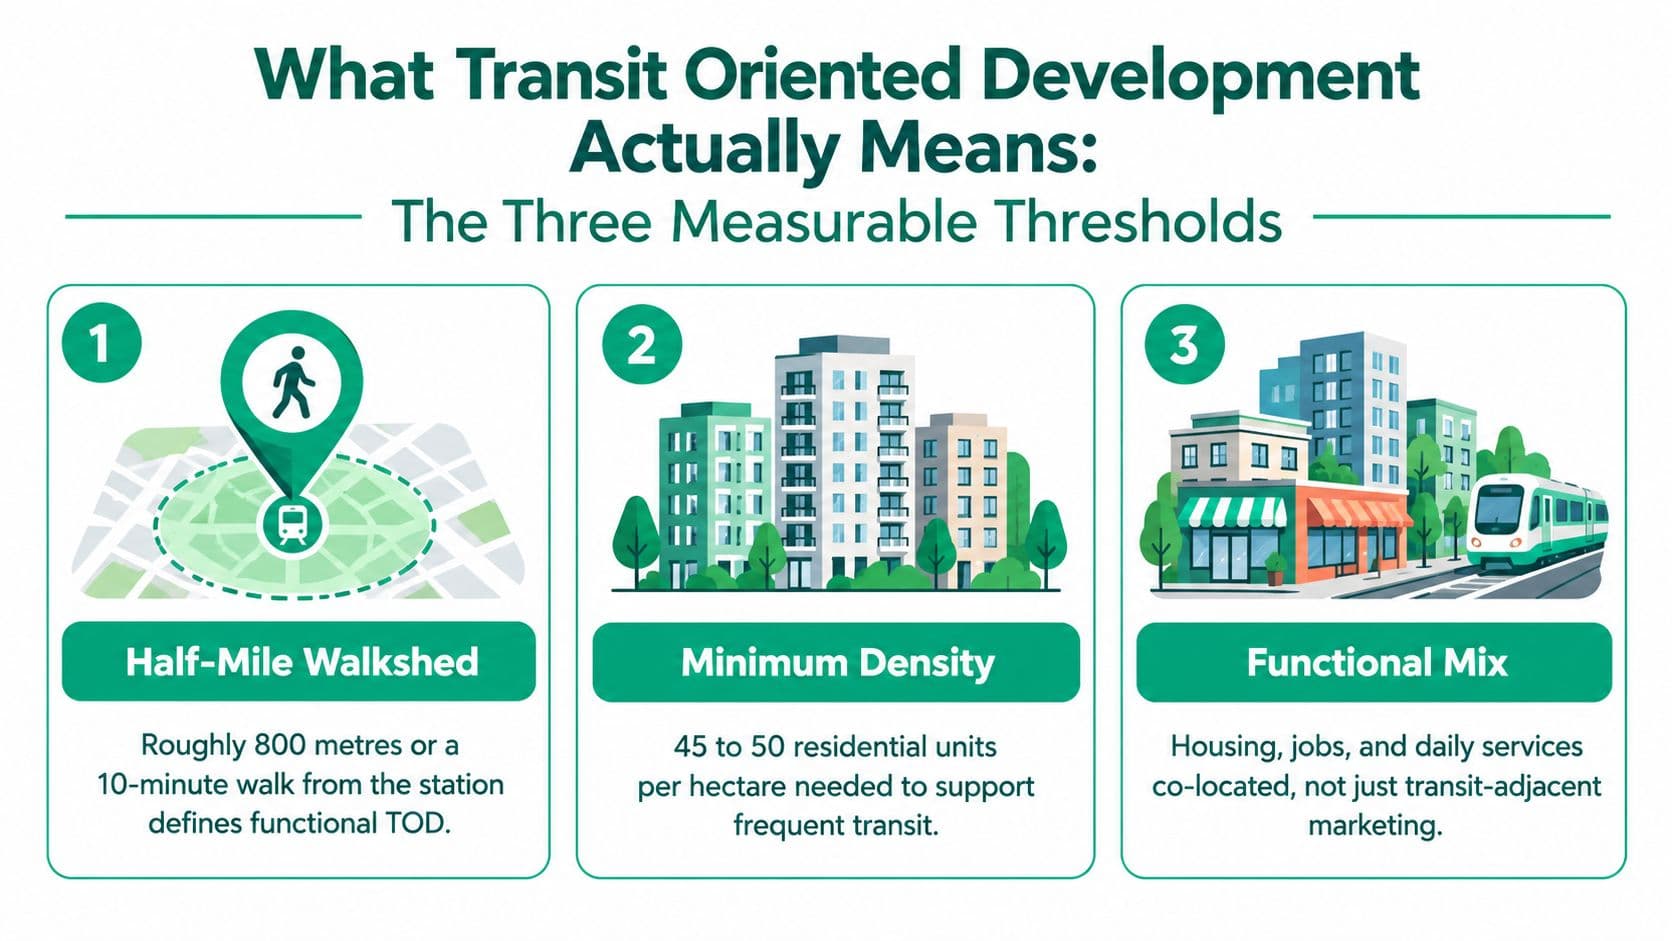
The three thresholds work together
A station's pedestrian shed is smaller than its full catchment. Buses, cycling, kiss-and-ride facilities, and feeder services can bring passengers from farther away, while the immediate walking area determines whether residents can reach transit without another motorised trip.
Buildings alone cannot produce the outcome. Streets must connect directly to the platform, ground floors need useful destinations, and the most intensive uses should cluster near the station instead of spreading evenly across the site. Commercial floor-area ratios and parking ratios matter, but they support the primary conditions of access, frequency, and activity.
Those planning decisions also create a fiscal choice. Improved accessibility can raise the value of nearby land, allowing cities to recover part of the publicly created uplift through a charge or tenure system. Site-value taxation collects revenue as assessed site value changes. Fixed land leases provide predictable public income while assigning some market risk to the leaseholder. Indefinite land-use rights, repriced annually, retain public control but require credible valuation and administration.
The smart growth principles guide connects compact development with infrastructure and land policy. The suitable instrument depends on administrative capacity, revenue needs, and how much development risk the public sector is prepared to retain.
A Brief History of Building Around Transit
Transit oriented development wasn't invented in the 1990s. Planning historians trace TOD-like patterns to the mid-19th century, when suburban housing and mixed-use growth began clustering around rail and tram routes in Europe and North America, as documented in this historical review of TOD.
London, Boston, and Philadelphia offer the basic historical pattern. Rail promoters needed passengers, while landowners wanted access to growing urban markets. Coordinated subdivision around rail corridors produced housing, shops, and streets that made the line useful and made surrounding land more attractive. The arrangement linked transport investment with land development long before modern zoning systems separated those decisions.
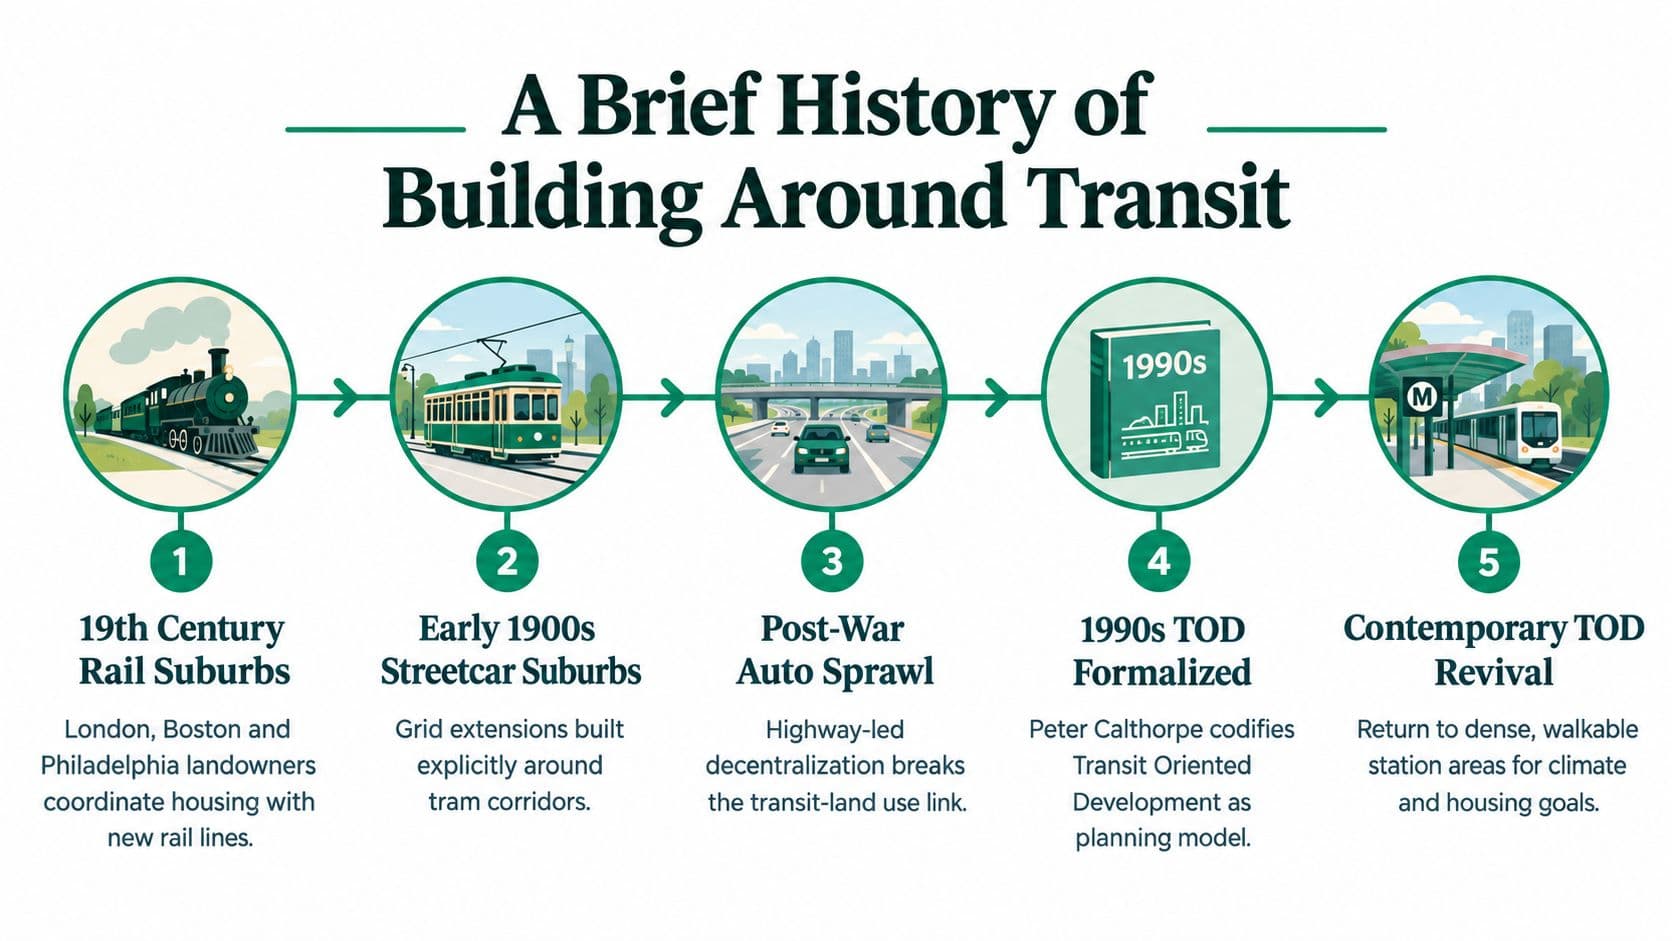
The pattern changes, but the economics persist
Streetcar suburbs and interurban corridors extended this model into the early 20th century. Developers laid out connected streets near tram routes because fixed transit made compact neighbourhoods commercially viable. The transit line wasn't just an amenity added after construction. It helped organise the development pattern from the beginning.
The post-war period reversed that relationship. Highway-led decentralisation, separated land uses, and generous parking standards weakened the connection between transit and urban form. Rail systems often inherited low-density surroundings that couldn't support frequent service, while new subdivisions assumed that nearly every trip would be made by car.
Peter Calthorpe codified and popularised the modern planning language of TOD in the late 1980s and 1993, but the historical practice was much older. The concept predates modern zoning by roughly 100 to 150 years, and its later global spread connected station-area development with regeneration, housing, and climate policy.
The recurring lesson is institutional, not nostalgic. Whenever a public authority coordinates fixed-guideway investment with land development, the value of accessibility reappears. The question is whether government captures enough of that value to fund infrastructure and protect residents, or whether the public pays for the rail while private landholders retain most of the gain.
Why Cities and Ministries Invest in TOD
A station-area project can generate housing, cleaner travel, and more compact growth. Its fiscal value comes from a different mechanism: public decisions improve accessibility, and that improvement can raise the rental value of nearby land. Finance ministries therefore need to assess TOD as both an urban-development policy and a potential revenue instrument.
The first channel is housing supply. Zoning that permits more homes near existing or planned infrastructure can reduce pressure to extend services into undeveloped areas. The second is mobility. Shorter distances, walkable access, and reliable transit can make non-car trips practical, reducing emissions and household transport costs. The third is sprawl containment, because growth is directed toward land already connected to networks.
These benefits do not automatically produce a public return. A station may increase the usefulness of surrounding sites, yet the authority still has to identify the uplift, value it, and recover it. Without a capture mechanism, the public may pay for rail, roads, utilities, and public space while landowners retain most of the gain.
Three instruments create different fiscal relationships. Site-value taxation charges against the value of serviced land, allowing revenue to rise as accessibility improves, but assessments and political acceptance can be difficult. Fixed land leases let the public retain ownership while granting development rights for a defined period. They can provide clearer control and recurring income, though lease terms must balance revenue with investment certainty. Indefinite land-use rights can encourage private development, but future land-value gains are harder to recover unless taxes or contractual conditions address them. The choice is institutional, not merely technical.
Inclusion remains a separate test. A Denver study found that housing costs were negatively correlated with transit ridership, indicating that rising prices can weaken the ridership gains a station strategy seeks. Recent coverage of 85 U.S. TODs found that only 20% of units were affordable, while nearly a third of TODs had no affordable housing at all, according to the Georgia Tech TOD affordability research.
| Benefit channel | What it delivers | Principal risk |
|---|---|---|
| Housing and accessibility | More homes and daily destinations near infrastructure | Land costs can outpace local incomes |
| Mobility and emissions | More viable walking, cycling, and transit trips | Infrequent service may not change travel behaviour |
| Sprawl containment | Growth focused around serviced corridors | Peripheral stations may lack demand or mixed uses |
| Public finance | A recoverable increment in land rental value | Weak valuation can produce unstable revenue |
| Inclusion | Transit access for lower-income households | Investment can displace intended riders |
Fiscal principle: TOD's principal product is increased accessibility that can generate a recoverable land-value increment.
Ministries should ask who receives that uplift, who pays for the station, which households can remain nearby, and whether the selected instrument captures value continuously or only at a politically difficult reset date.
Planning and Design Elements That Make TOD Work
A station district succeeds when its physical form converts access into daily convenience and, ultimately, into land value that public policy can recover. Start with a mapped walkshed rather than an arbitrary circle. An 800-metre boundary, adjusted to actual routes, should account for barriers, crossings, slopes, and the paths people will use. That map defines the area for zoning, infrastructure, and fiscal analysis.
Within the walkshed, planners can establish a residential density baseline of roughly 45 to 50 units per hectare, place greater intensity near the station, and taper it through a transition zone. Core floor-area ratios of 3.0 to 5.0 may support vertical mixed use where infrastructure and demand can carry it. These are design settings, not promises of ridership or revenue.
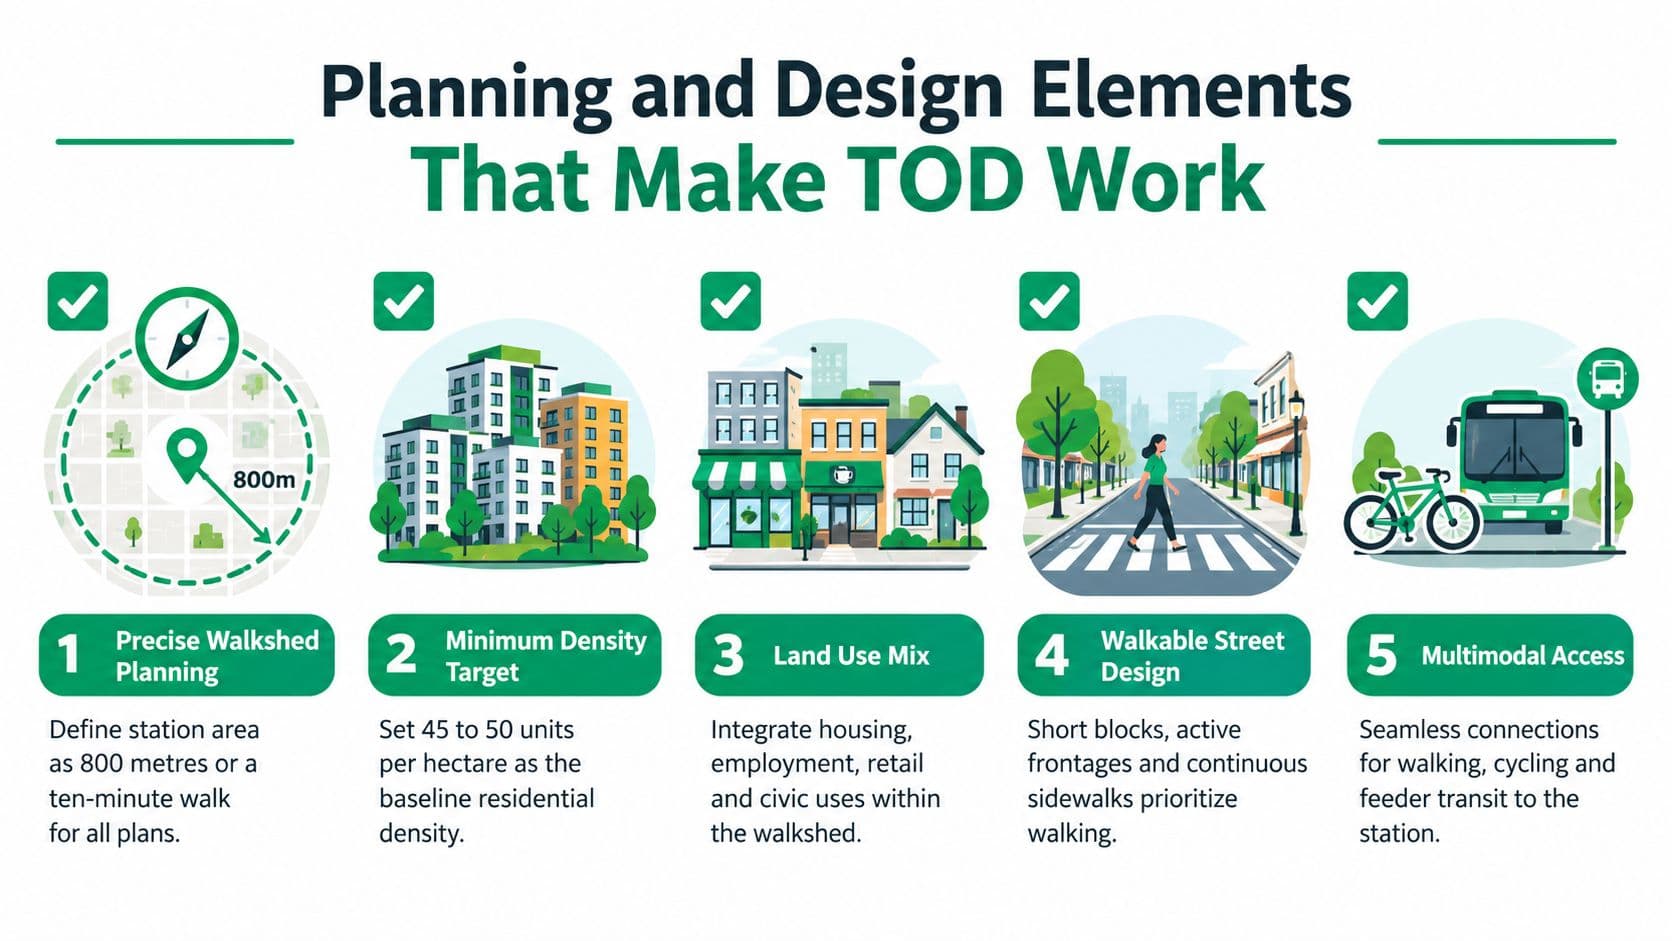
Build the district around daily life
Place retail, childcare, food, and community services at grade, offices and institutional uses on middle floors, and homes above. The vertical mix keeps streets useful across the day and reduces the need to allocate each function to a separate site. It also makes the station area easier to read, a quality illustrated by these new urbanism examples.
Parking policy determines whether that compact pattern is financially possible. Earlier TOD research found peak parking demand below one-half of the standard ITE parking supply guideline for most projects. Replace minimums with parking maximums where appropriate, price spaces, and separate parking charges from housing rents. The released land can then support homes, shops, or public space rather than subsidised vehicle storage.
The public realm must carry the added density. Require active ground floors along the first 30 metres of frontage, short blocks, continuous sidewalks, safe crossings, protected bicycle lanes, bus-transfer priority, and shared-mobility bays sized to forecast demand. Design review should set build-to lines, tree canopy requirements, and shadow-sensitive massing. A dense but hostile street can reduce the access premium that fiscal instruments seek to capture.
Owners and project teams also need clear communication. Guidance on how to market real estate with social can help explain location, amenities, and construction progress, while keeping promotional material separate from evidence of transport performance. Planning teams should test the resulting street, use, and public-realm pattern against the chosen financing instrument, since design affects both appeal and the land value available for recovery.
Financing TOD Through Site Value Capture
A station-area finance plan should distinguish three instruments that are often treated as interchangeable. They aren't. Site-value taxation is a recurring public assessment on land value, while a fixed land lease is a contractual tenure with a known term and price structure. An indefinite land-use right has no expiration and is repriced each year to the site's current rental value, according to the definition of a genuine land-use right.
Three instruments, three risk allocations
Site-value taxation reassesses the unimproved value of land and charges the owner on that basis. The public sector shares in accessibility gains as they emerge, rather than waiting for a sale or lease renewal. A land-value tax is a recurring assessment, usually billed annually, which differs mechanically from both lease structures, as explained in this comparison of land-value tax and land tenure.
Fixed land leases can be renewable or non-renewable. A fixed-term lease expires on a known date and carries a fixed price or contractual adjustment. A renewable fixed lease resets at renewal. In either case, the lease postpones risk rather than pricing it correctly. A renewable lease offers certainty only until expiry, then may close the accumulated gap between contract rent and market rent through a major repricing. A non-renewable lease can become progressively harder to refinance and sell as the expiry date approaches.
An indefinite land-use right works differently. It has no expiration, requires no renewal, and is repriced annually. Annual repricing means buyers and sellers don't need to price a large expiry cliff into the asset, lowering transfer friction relative to fixed-term arrangements, as set out in the comparison of land-use rights and leases. Sometimes fixed leases are casually called land-use rights, but they aren't. Use that term only when all three criteria apply.
| Instrument | Mechanism | Risk profile | Representative use |
|---|---|---|---|
| Site-value tax | Recurring charge based on current unimproved land value | Public revenue moves with land conditions; owners face regular liability | Station-area tax reform |
| Fixed land lease | Contracted rent for a fixed term, renewable or non-renewable | Risk accumulates and may surface at expiry or renewal | Public land development agreements |
| Indefinite land-use right | No expiry, no renewal, annual repricing to current rental value | Avoids expiry cliffs and prices location value continuously | Publicly retained land with transferable occupancy rights |
| Developer contribution or special assessment | Charge linked to development or assessed benefit | Usually captures only part of the uplift and may weaken during downturns | Station infrastructure funding |
| Tax-increment finance | Earmarks future tax growth for current borrowing | Depends on the tax base and can redirect revenue from other services | Area-based capital works |
A land-value uplift analysis helps finance teams model the source and timing of the gain before selecting an instrument. Developer contributions, special assessment districts, and tax-increment finance can all help, but each generally captures only a share of the appreciation created by rezoning and transit.
The practical choice is therefore about risk, not branding. If the public sector needs a recurring claim on location value, annual taxation or annual repricing is more transparent. If it uses fixed leases, it should disclose the expiry risk, maintain a renewal policy, and avoid pretending that a delayed repricing is no repricing at all.
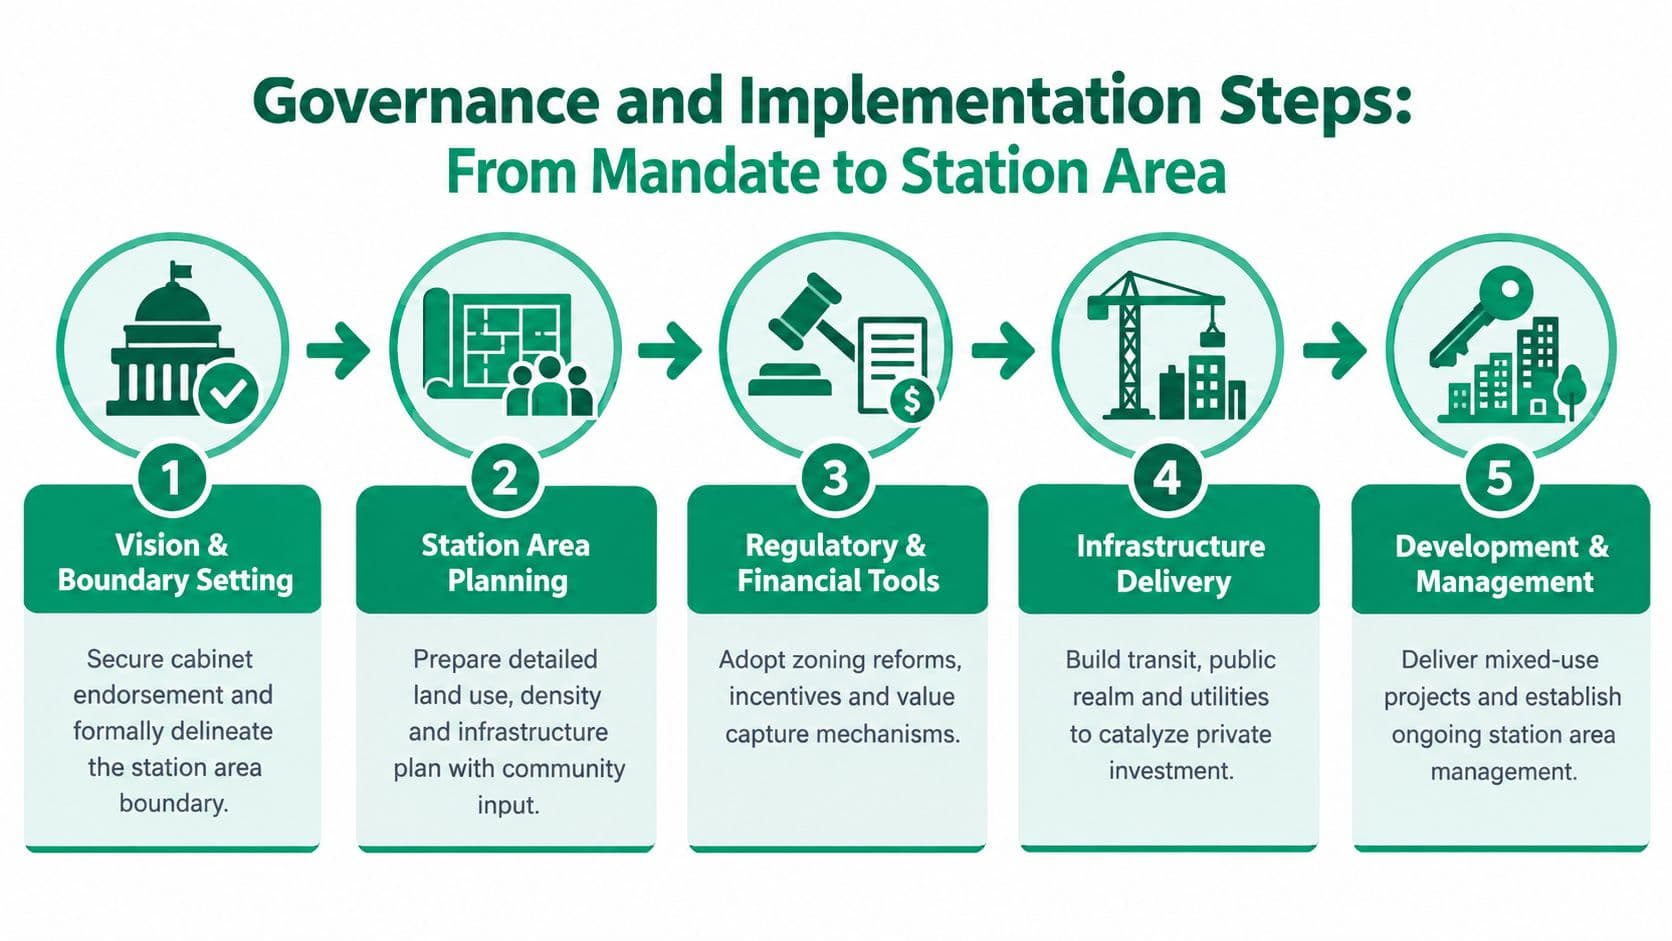
Governance and Implementation Steps
TOD fails when the transport authority, planning department, land agency, utility, and finance ministry pursue separate station-area plans. A delivery sequence should assign responsibility before the first rezoning vote.
Start with a binding boundary
The political mandate should establish a station-area typology and lock the walkshed into zoning maps before substantial developer engagement. Boundary changes made after land assembly begins can create windfalls for some parcels and undermine confidence in the value-capture model.
The evidence and finance phase follows. Assemble parcel data, title searches, existing rents, development capacity, infrastructure costs, and a value-capture yield model. The model should show how much of the rail premium each instrument could recover, who bears the charge, and how revenue behaves under weaker market conditions.
Connect approval to public obligations
Stakeholder engagement should include affected owners, adjacent communities, existing tenants, small businesses, and transit operators. Community benefit agreements can connect project approval to affordability, relocation support, local hiring, public-realm improvements, and commercial protections.
A city also needs disciplined real-estate analysis before it promises a station-area program. Resources on site selection and due diligence can help structure parcel review, ownership checks, access analysis, and development constraints.
Statutory enablement then converts the plan into authority. Rezone the area, adopt the value-capture bylaw or special-assessment ordinance, and pre-clear environmental, utility, and stream-grid approvals where applicable. The legal framework should specify assessment methods, appeals, collection, earmarking, audit, and review.
Delivery may sit with a special-purpose vehicle or station-area authority that bundles land assembly, infrastructure, and land disposition. That body needs a clear public mandate and transparent reporting, not merely commercial autonomy.
Finally, sequence demolition, tenant relocation, construction, and interim uses. Existing residents and small firms shouldn't become collateral damage of the appreciation the project is designed to create. The stakeholder engagement strategies guide offers a useful reference for designing participation around affected groups rather than treating consultation as a late-stage presentation.
Metrics That Tell You TOD Is Actually Working
A station can win planning awards and still underperform financially or socially. A useful scorecard therefore links transport, land use, inclusion, and public finance, rather than treating each outcome as a separate project.
Start with transit performance. Track weekday boardings per station, peak-hour loads against capacity, and the mode share of trips beginning inside the walkshed. High density with weak boarding points to a service, access, fare, or displacement problem. The metric identifies a signal, not its cause, so agencies should investigate those conditions before changing land-use policy.
The next tier measures the district's physical composition. Use net residential density in dwellings per acre, jobs-housing balance, and the share of mixed-use frontage along the main corridor. Together, these indicators show whether the area supports daily activities or places residential towers beside a transport facility.
Measure who benefits
Affordability and inclusion require their own measures. Monitor the median price-to-income ratio for station-area homes, the share of income-restricted units, and displacement indicators for incumbent small businesses. Housing costs also affect ridership. As noted earlier, TOD affordability research links higher housing costs with lower transit ridership in a Denver study.
Public finance forms the fourth tier. Report value-capture yield per unit of transit investment, incremental property-tax revenue against a baseline, and lease-encumbrance coverage on publicly owned land. These measures help ministries distinguish a fiscal instrument that supports public costs from a development narrative that merely reports private activity.
| Tier | Indicator | Target threshold | Why it matters |
|---|---|---|---|
| Transit | Boardings, capacity, walkshed mode share | Set locally from baseline and service plan | Shows whether access changes travel |
| Land use | Residential density, jobs-housing balance, mixed-use frontage | Compare with adopted station-area standards | Shows whether land use supports service |
| Inclusion | Price-to-income ratio, restricted units, small-business displacement | Set affordability and anti-displacement goals | Tests whether existing and lower-income users remain |
| Fiscal | Capture yield, incremental tax revenue, public-land coverage | Tie to investment and debt obligations | Shows whether uplift supports public costs |
Publish the dashboard annually and maintain five-year trend lines. A quality-of-life measurement framework can add resident well-being measures, but it should not replace transport, inclusion, or fiscal indicators. The same definitions should support budget review, planning review, and community accountability, making it possible to compare whether site-value taxation, fixed leases, or other land instruments are producing the intended public return.
Common Pitfalls and How to Mitigate Them
The most common mistake is calling a station surrounded by parking TOD. A stop without density, connected streets, or daily destinations may deliver access without enough demand to support frequent service. Tie upzoning to revenue service, prepare infrastructure early, and secure developer interest before the station opens.
Displacement creates a second failure. Higher accessibility can raise land and housing costs before transit benefits reach existing households. Protect lower-rent residents and ground-floor firms with community benefit agreements, step-up commercial rents, commercial eviction protections, relocation support, and a right of first refusal for existing tenants where legally feasible.
Lease-cliff repricing deserves separate treatment. A renewable fixed lease can appear affordable for years, then force a large reset when renewal arrives. A non-renewable lease can lose transferability as its remaining term shortens. Cities using fixed leases should publish the expiry schedule, stress-test refinancing, and avoid mislabeling these contracts as land-use rights.
Align the institutions and the money
Fragmented governance creates delays and contradictory promises. Give one station-area coordinator authority to align the transit operator, municipality, utility, housing agency, and landowner. Pool infrastructure accounts so that sidewalks, utilities, access roads, and public spaces aren't funded through disconnected negotiations.
Higher station-area prices can also trigger a ridership-price feedback loop. If lower-income households leave, the system may lose regular users even as land values rise. Pair density with integrated housing, protected affordable units, and feeder services that respond to gaps in the network.
Finally, don't confuse value capture with free operating revenue. If taxes or assessments intended for capital works fund general operations, residents may see the charge as an unbounded tax rather than a transparent exchange. Use statutory earmarks, public audit trails, and sunset reviews tied to debt service and delivery milestones.
The 2025 Urban Institute tracking project reflects a broader shift toward measuring housing delivered in transit areas and distinguishing existing service from service under construction, as discussed in this review of TOD research and implementation gaps. That shift is essential. A city should approve TOD only when it can state what will be built, who will benefit, how value will be recovered, and which indicators will trigger correction.
Unitism® helps governments and public institutions connect transit-corridor planning with land valuation, value-capture design, distributional modelling, and implementation workflows. Visit Unitism® to examine how site-value taxation and annually repriced land-use rights can fit a station-area finance strategy without creating fixed-lease expiry cliffs.