Master the land to value ratio with a clear formula, worked examples, and guidance on using it for valuation and land-value capture policy.
October 11, 2026
Land to Value Ratio: Formula, Interpretation, and Uses
Master the land to value ratio with a clear formula, worked examples, and guidance on using it for valuation and land-value capture policy.

What portion of a property's price comes from the building, and what portion comes from occupying that location? That question exposes a weakness in many property assessments: total market value combines two economically different assets, the site and the improvements. A land to value ratio separates them, making it possible to see whether appreciation reflects scarcity, accessibility, planning decisions, infrastructure, or the replacement value of construction.
For appraisers, the ratio is a measurement problem. For governments, it's a policy diagnostic. A defensible estimate can inform mass appraisal, housing policy, land-value capture, and financial-risk analysis, but a convenient benchmark can mislead all four.
Table of Contents
- Why Separating Land from Buildings Matters
- What Is the Land to Value Ratio and How to Calculate It
- Estimation Methods and When to Use Each
- How Ratios Vary Across Markets and Property Types
- Leases, Land-Use Rights, and Land-Value Taxation
- Policy Implications and Distributional Considerations
- Building Reliable Estimates for Valuation and Reform
- Using the Ratio for Policy Analysis and Risk Assessment
- Quick Reference and Next Steps
Why Separating Land from Buildings Matters
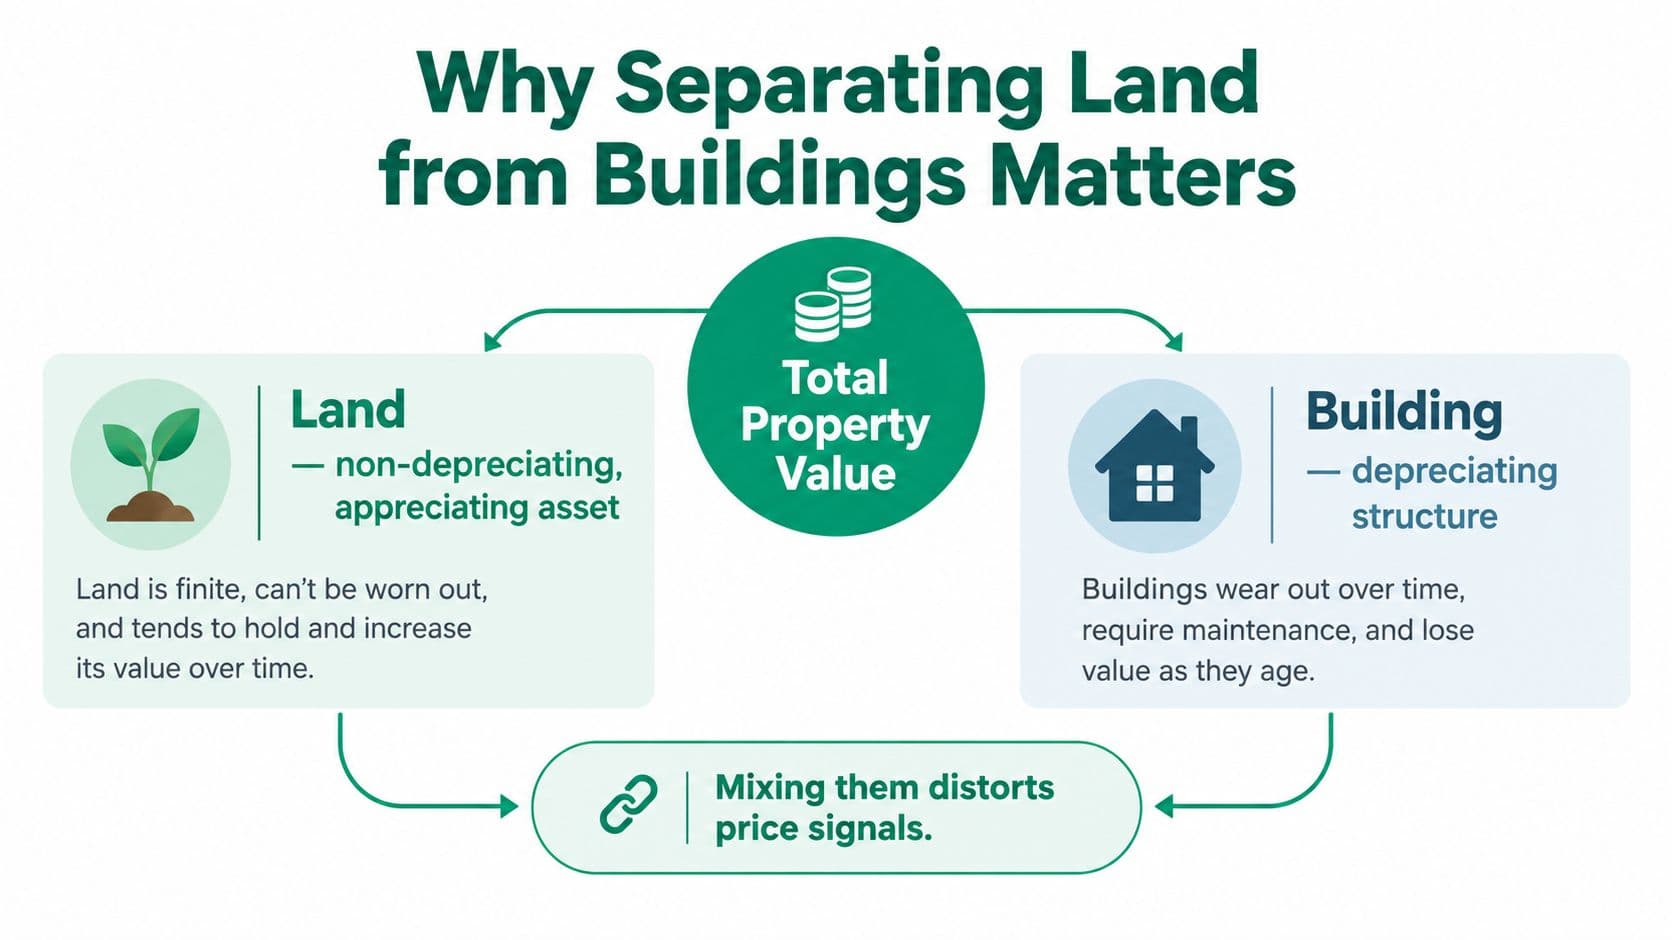
A property's sale price doesn't tell you what buyers are paying for. It combines the value of the location itself with the value of the building, fixtures, and other improvements on that site. The building may wear out, require replacement, or become functionally obsolete. The site can gain value as access improves, demand grows, developable land becomes scarce, or public investment makes the location more attractive.
Separating those components changes the policy question. A rising land share suggests that a larger portion of appreciation is being assigned to location, scarcity, access, regulation, and public investment advantages, rather than to construction cost. A low ratio may indicate that the improvements carry most of the price, although it doesn't by itself prove that land is abundant or efficiently used.
The national picture
In the United States, land alone was valued at approximately $735.8 billion in 1975, compared with $10.8 trillion in 2005. By 2005, land represented roughly 31% of total U.S. real-estate value, according to the Lincoln Institute's analysis of land value in the United States.
Those figures are a broad benchmark, not a parcel-level rule. Land is commonly derived as the residual after subtracting structure value from total property value. That makes the result sensitive to construction-cost assumptions, depreciation estimates, and housing-price data.
A practical land-value framework therefore needs three things: a clear definition, a transparent formula, and an explicit account of how the estimate was produced. Without those, a ratio can look precise while hiding assumptions that materially affect tax design, investment analysis, and public claims about land use. A useful introduction to the underlying distinction appears in this guide to land value and its economic meaning.
What Is the Land to Value Ratio and How to Calculate It
The land to value ratio, also called land share, measures the value of the site against the value of the complete property:
LTV = V land / V property
In plain terms, divide the estimated land value by the total market value of the property. The result indicates where value sits between the site and its improvements at a particular point in time. It isn't a permanent characteristic of the parcel, because both components and the assumptions used to estimate them can change.
Use compatible values
The numerator and denominator must be comparable. For mass appraisal and policy analysis, use market-consistent values, not raw assessed values that may reflect different valuation dates, exemptions, assessment ratios, or administrative rules. Mixing a current market estimate for the building with an outdated land assessment produces a ratio that may be mathematically correct but economically incoherent.
Where vacant-land comparables exist, direct sales comparison is generally the strongest approach. If those sales are scarce, recognized alternatives include allocation, abstraction or extraction, capitalization of ground rent, land-residual capitalization, and land build-up methods. The Iowa assessment guidance on land valuation methods provides a practical administrative template for applying and documenting these approaches.
For readers beginning with parcel research, this guide to finding land value with Dollar Land Store offers useful orientation on the information that supports a site estimate. For a deeper treatment of residual land value, see the residual land value method.
The ratio is most useful when treated as a snapshot with a method attached, not as a standalone truth. Record the market date, property type, zoning, highest-and-best use, source sales, improvement assumptions, and any adjustments. Those details are what make the result reviewable.
Estimation Methods and When to Use Each
Method choice should follow the evidence available in the market. A direct vacant-land sale is valuable because it observes the site without requiring a separate estimate of building contribution. The challenge is finding a comparable site with a similar highest-and-best use, zoning, location, physical characteristics, and market date.
Match the method to the evidence
-
Direct sales comparison works best when recent, arm's-length vacant-site sales are available. Adjust for differences in permitted use, access, services, size, and development potential.
-
Abstraction or extraction starts with an improved-property sale and subtracts the depreciated contributory value of the improvements: V land = P sale − V improvements. The improvement value must reflect market contribution, not merely accounting depreciation.
-
Allocation infers the land component from observed relationships between land and total property values in comparable transactions. It's useful when the market provides enough paired evidence, but weak when the comparison group is heterogeneous.
-
Ground-rent capitalization converts an observed or estimated ground rent into a land value using a market-supported capitalization rate. It requires reliable rent and rate evidence.
-
Land-residual capitalization estimates the amount left for land after accounting for the value and required return of development or improvements. It can support development analysis, but outputs depend heavily on assumptions about costs, income, timing, and permitted density.
-
Land build-up methods assemble site value from separate indicators such as location, access, services, and development rights. They're practical where direct sales are limited, but require a transparent adjustment framework.
Iowa's guidance identifies these six methods and requires an unimproved adjustment factor for unimproved sites, a useful administrative safeguard when improved and vacant properties are compared. A broader review of mass appraisal methods helps connect parcel-level estimates to consistent portfolio practice.
Practical rule: Don't use accounting depreciation as a substitute for market depreciation. Ask what buyers would pay for the improvements in their current condition and use.
The same discipline applies outside residential appraisal. If a city is evaluating redevelopment corridors, a resource such as high street expansion guidance may help frame access, use, and development context, but it can't replace local comparable evidence.
How Ratios Vary Across Markets and Property Types
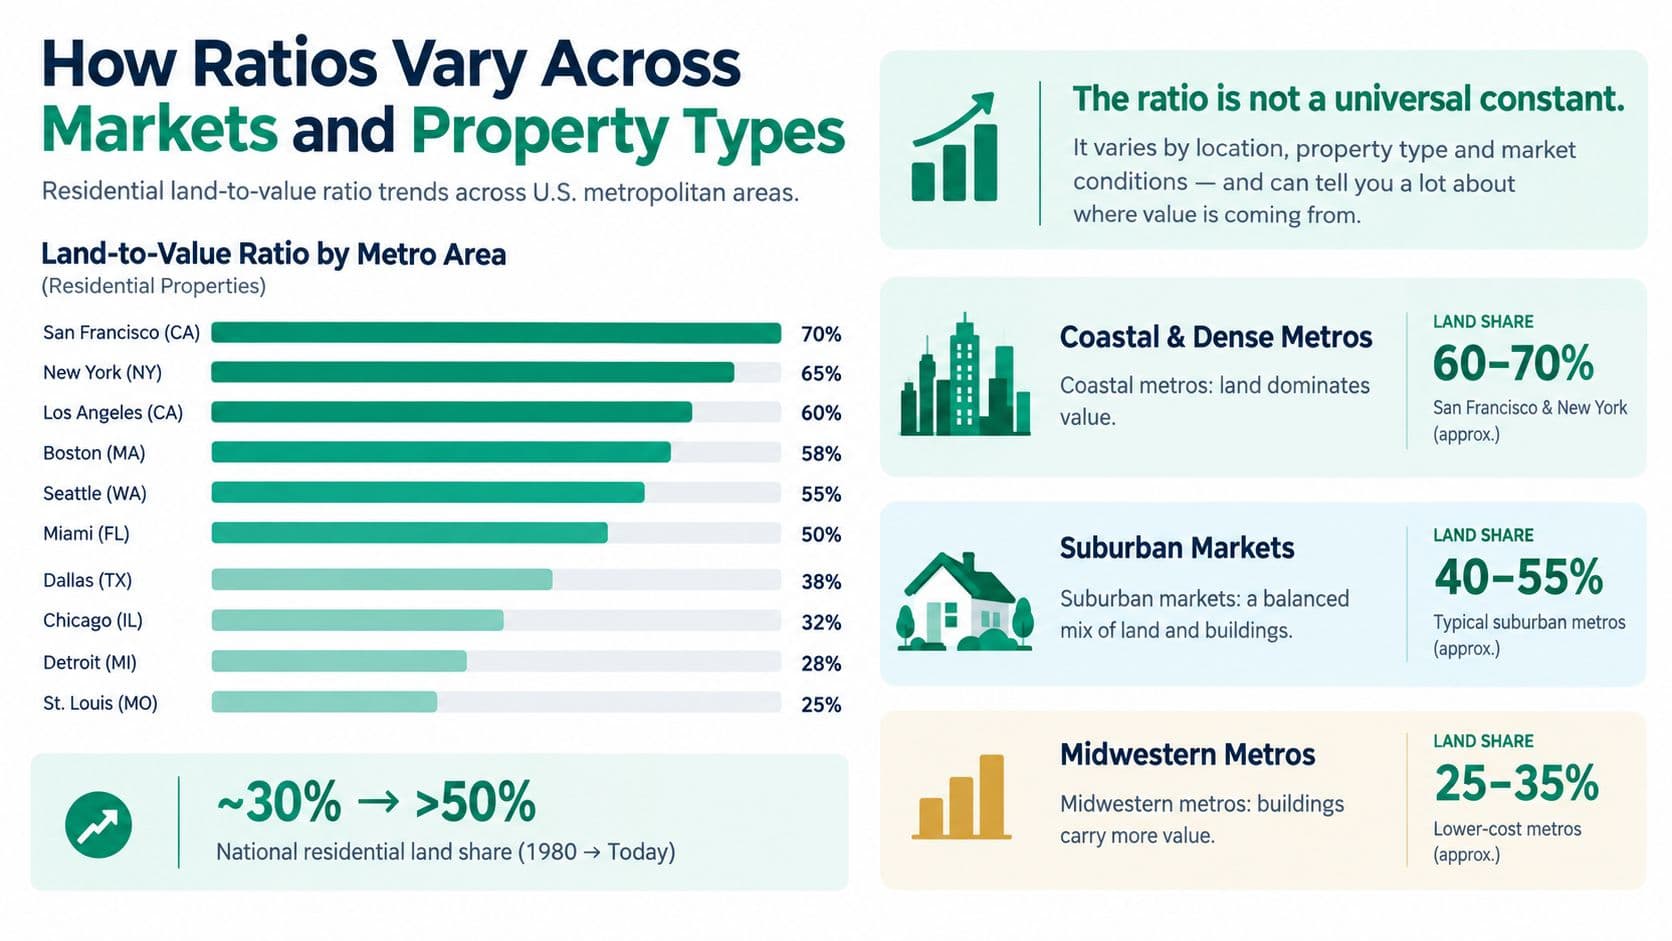
A single national ratio can conceal radically different housing economics. In a supply-constrained coastal market, buyers may pay primarily for access to a location and its permitted development potential. In a less constrained market, the building may account for most of the sale price because land scarcity and demand are weaker.
Residential land represented about 32% of total housing value across a Federal Reserve sample of large U.S. cities in 1984, rising to approximately 50% by year-end 2004. The same study reported large East Coast cities rising from about 38% to 64%, while West Coast cities rose from roughly 55% to 74%. These figures are reported in the Federal Reserve study of residential land values.
Local variation is the point
A Bureau of Economic Analysis working paper reported a median land share of 26.4% across 46 metropolitan areas in the first quarter of 2016, with a low of 6.2% in Rochester and a high of 80.9% in San Francisco, as documented in the same Federal Reserve-linked research discussion.
Those differences can arise from accessibility, permitted density, scarcity, neighborhood demand, construction costs, building age, and improvement quality. They also reflect the market date. A ratio estimated during rapid land appreciation won't necessarily describe the same neighborhood after zoning changes, infrastructure investment, construction-cost shifts, or population movement.
The practical consequence is straightforward. Housing policy, fiscal analysis, and land-value assessment need estimates measured at a sufficiently local level and updated through time. A citywide average may be useful for an initial diagnostic, but it shouldn't determine parcel charges, redevelopment assumptions, or transition protections without segmentation by geography and property type.
Leases, Land-Use Rights, and Land-Value Taxation
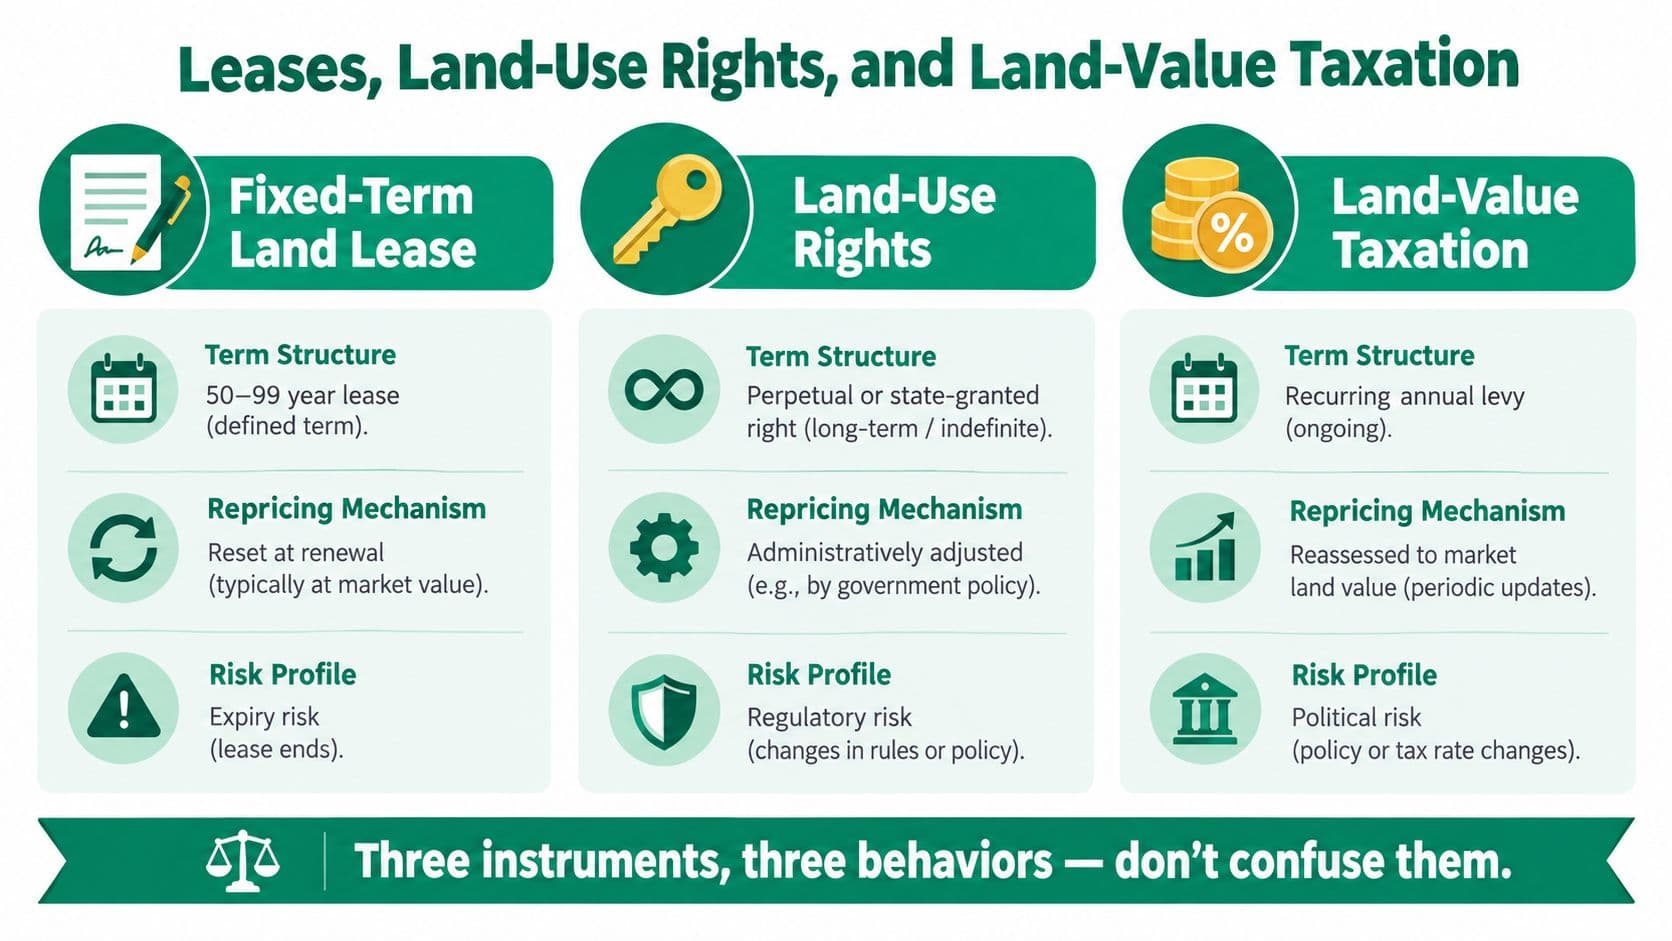
Governments often compare land-based instruments as if they were interchangeable. They aren't. A fixed-term land lease, an indefinite annually repriced land-use right, and a land-value tax differ in legal basis, duration, repricing, and risk allocation.
Fixed leases postpone risk
A fixed land lease transfers a time-limited contractual right to use land at a contractually fixed price. Public ground leases commonly run for more than 50 years, may include renewal options, and often specify permitted improvements and land-use conditions, according to the Lincoln Institute's discussion of public land leasing.
A renewable lease offers certainty only through the current term. If market land values rise while the rent remains fixed, the accumulated gap may be closed at renewal through a single, substantial repricing. A non-renewable lease creates a different exposure. As expiry approaches, the remaining right becomes less attractive to buyers and lenders, making resale and refinancing progressively harder.
Fixed leases, in effect, postpone risk rather than price it continuously.
Genuine land-use rights work differently
A land-use right may resemble a lease in granting occupation or use, but it qualifies as a genuine land-use right only when it is:
- Indefinite, with no expiration date.
- Non-renewable by design, because renewal isn't required.
- Repriced annually to reflect current land conditions.
Annual repricing keeps the value of access visible without creating a renewal cliff or a declining term discount. Because the right doesn't expire, buyers and lenders don't need to negotiate a remaining-term premium or discount in the same way they do with a fixed lease. A fixed lease sometimes gets labeled a “land-use right,” but the label doesn't change its economics. If it expires, requires renewal, or locks the charge until expiry, it's still a fixed lease.
For practical leasehold questions, London homeowner leasehold tips can help explain the valuation consequences of term and renewal provisions.
A tax is a public charge
A land-value tax is a public charge on the value of land itself, imposed through public law to fund services or infrastructure. It isn't a private contract for possession, and it doesn't transfer a defined leasehold interest from a freeholder to a lessee.
The distinction matters for policy design. A tax is administered by a taxing authority. A fixed lease is governed by contract and concentrates repricing or expiry risk. An annually repriced indefinite right keeps the land charge current while avoiding a renewal event. Treating these instruments as synonyms makes it harder to forecast revenue, explain obligations, and protect productive investment.
Policy Implications and Distributional Considerations
A high land to value ratio doesn't automatically mean a large lot, an inefficient owner, or a vacant opportunity. It may reflect low-quality improvements, redevelopment potential, planning constraints, or rapidly rising location value. A modest building on a strategically located parcel can produce a high ratio even when the owner isn't withholding land from use.
Earlier assessment research found ratios ranging from below 15% to above 50%, with strong relationships to living area, construction quality, building age, and neighborhood. The same research found that land share wasn't strongly correlated with lot size, while a mass-appraisal study found materially different assessed land shares among houses, apartments, and high-rise apartments, as documented by the Lincoln Institute's assessment research.
Ask who bears the charge
Separating land from improvements creates a distributional question: who pays when the site is valuable but the building is modest? A uniform land-based charge can place pressure on owners of valuable, lightly improved sites while treating intensive, high-quality construction more favorably. That may encourage development in one setting, but it can create hardship where redevelopment is blocked by zoning, heritage rules, financing constraints, or inadequate infrastructure.
Policy dashboards should therefore show more than the headline ratio. Pair it with:
- Permitted floor area, including development rights that the owner can legally exercise.
- Current use, so an underbuilt parcel isn't confused with a fully utilized one.
- Improvement condition, age, quality, and functional usefulness.
- Tenure, including ownership and lease arrangements.
- Neighborhood income, to identify potential household and community impacts.
- Infrastructure and service access, which can explain part of the site premium.
A serious distributional analysis should model who gains, who pays, and when. It should also test transition measures rather than assuming that a technically consistent ratio produces an equitable reform.
A ratio is a diagnostic signal, not a verdict on the owner.
That distinction protects policy from a common error: using land share as a moral judgment instead of as evidence that requires context.
Building Reliable Estimates for Valuation and Reform
How do you turn a land to value ratio into something a valuer, tax authority, or finance ministry can use? Start with the evidence base. For policy work, the ratio is not just an appraisal output. It is a diagnostic that helps test whether a land-value capture tool fits local conditions, and that depends on how well the estimate reflects specific parcels, rights, and market segments.
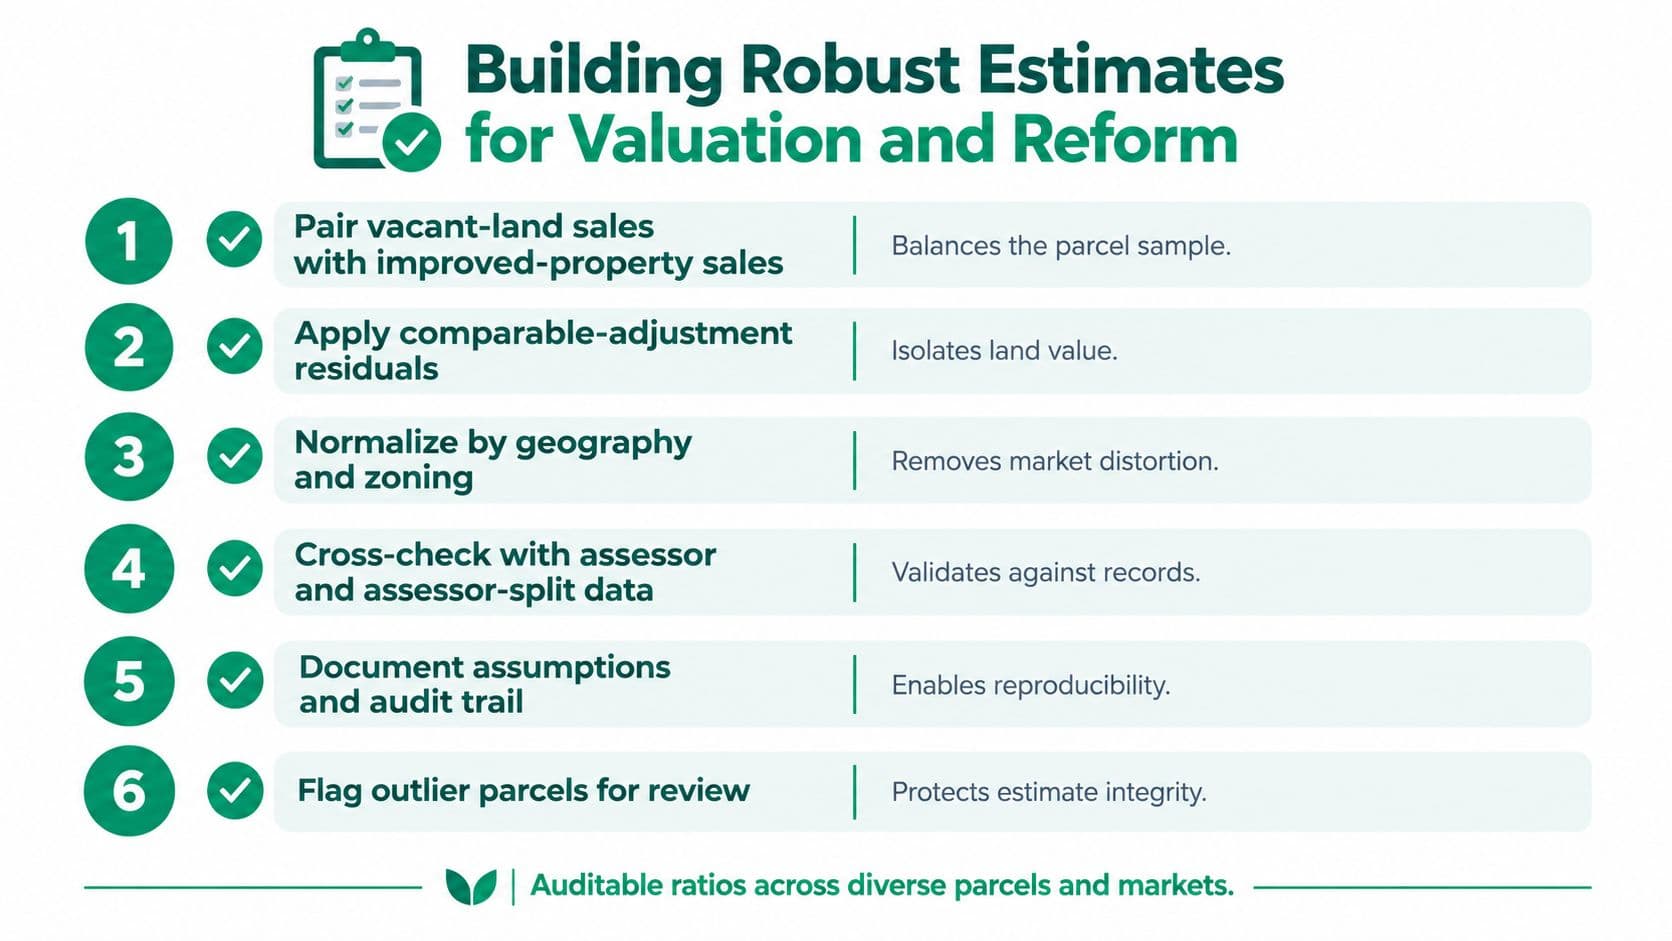
Reliable estimates come from better inputs and clear method choices. Combine vacant-land sales with improved-property sales, align observations by geography, zoning, and valuation date, and make each assumption visible when converting total sale prices into separate land and improvement values.
A practical quality-control sequence
-
Pair vacant and improved sales. Vacant sites give direct evidence on land. Improved sales show how buyers price the whole asset. Using both helps limit bias from any single method.
-
Apply comparable-adjustment residuals. Where vacant-land evidence is thin, estimate the improvement contribution and deduct it from the improved sale price. Keep every adjustment explicit so reviewers can test it.
-
Normalize geography and zoning. Separate neighborhoods, permitted uses, density, access, and market dates before deriving a benchmark. Otherwise, the ratio may reflect a change in property mix rather than a true shift in land value.
-
Cross-check assessor components. Assessor splits between land and improvements can help identify outliers and administrative inconsistencies. They should not automatically override estimates grounded in market evidence.
-
Document the audit trail. Record the sales used, depreciation assumptions, capitalization rates, permitted uses, adjustment factors, and reviewer decisions. Another analyst should be able to reproduce the result.
-
Flag unusual parcels. Redevelopment sites, underbuilt properties, heritage buildings, leaseholds, land-use rights with restrictions, and parcels with disputed interests need separate review because the ratio can otherwise misstate what is really being taxed or captured.
A Montreal study of 14,715 residential sales found land's share ranged from 19.5% to 63.1%, with an average of 37.4%. Alternative methods produced averages of 34.8% and 39.9%, as reported in the study of land and building value separation.
Report a range, not false precision
Location usually changes land value far more than building value. Methods based only on improved-property sales can therefore understate the land component. Report a range, test sensitivity by neighborhood and property type, and keep market value, assessed value, replacement cost, and residual land value distinct. Then disagreement becomes useful. Reviewers can challenge a specific assumption, which is exactly what good reform design requires when comparing leases, land-use rights, and land-value taxation.
Using the Ratio for Policy Analysis and Risk Assessment
Once estimated consistently, the ratio becomes more than an appraisal output. It can indicate whether location rents are capitalizing faster than construction costs. A rising ratio may signal stronger demand for access, scarcity, or permitted density. A falling ratio may reflect weaker accessibility or relatively valuable improvements.
FHFA research using millions of single-family appraisals from 2012 to 2019 found that land prices rose faster than house prices in large metropolitan areas, increasing land share, while land share declined in smaller metropolitan areas. The research is summarized in FHFA's paper on residential land prices and shares.
Use the ratio as a warning indicator
For housing policy, map the ratio by market segment rather than applying one citywide parameter. Track land prices, construction costs, zoning, infrastructure, and population change separately. This helps distinguish a location-value surge from a building-cost shock or a change in permitted development.
The ratio can also support financial-risk screening. A study using approximately 70,000 Orange County, California properties from 2005 to 2015 found that a 10-percentage-point increase in land share was associated with a 1.54-percentage-point increase in mortgage-default probability, according to the FHFA source above. That association doesn't establish that land share causes default, but it identifies a relationship worth testing in underwriting and portfolio monitoring.
For land-value capture, use the ratio to model scenarios, not to dictate a single charge. Test how different estimates affect owners by tenure, improvement condition, neighborhood, and permitted use. Then pair the results with transition measures and administrative capacity.
Decision test: If a ratio changes the proposed policy, show which sales, assumptions, or local conditions caused the change.
That standard turns a static percentage into an explainable policy instrument.
Quick Reference and Next Steps
Practitioners usually need a short decision rule before they need another theory lesson. Start with the market evidence, then match the method to the parcel and the purpose.
| Question | Practical response |
|---|---|
| Are credible vacant-site comparables available? | Prefer direct sales comparison, with adjustments for use, zoning, location, physical characteristics, and market date. |
| Are only improved-property sales available? | Consider abstraction or extraction, and subtract the market contribution of improvements rather than accounting depreciation. |
| Is ground rent observable? | Consider capitalization, using a market-supported capitalization rate. |
| Is the estimate for mass appraisal? | Standardize data, document assumptions, and test results across neighborhoods and property types. |
| Is the estimate for reform? | Pair the ratio with zoning, infrastructure, tenure, improvement condition, and distributional impacts. |
Pitfalls worth catching early
- Assessed value isn't automatically market value. Check dates, exemptions, assessment ratios, and component definitions.
- A national benchmark won't describe every market. Local land scarcity, demand, access, and construction economics drive the result.
- A high ratio isn't proof of inefficient ownership. Review improvement quality, redevelopment rights, planning constraints, and current use.
- A fixed lease isn't an annually repriced land-use right. Confirm that the arrangement is indefinite, requires no renewal, and reprices each year.
- A precise number can still be fragile. Publish sensitivity tests and an uncertainty range rather than concealing method dependence.
The next practical step is to build a transparent dashboard that maps land share beside permitted density, current use, infrastructure, property type, and neighborhood conditions. For a government, that dashboard can support fiscal modeling and staged reform. For an appraiser, it creates a defensible record of how the estimate was formed. For a lender or investor, it clarifies how much of the price depends on the site rather than on the structure.
A land to value ratio is useful precisely because it forces better questions. Who created the location advantage? Which rights does the parcel carry? Which assumptions assign value to the site, and who bears the consequences when those assumptions change?
Unitism® offers land valuation assessments, data frameworks, distributional modeling, and implementation support for governments designing land-value capture reforms. To connect parcel-level land to value analysis with fiscal and transition planning, visit Unitism®.