Distributional analysis explained for tax and land reform. Learn the methods, data, and workflows used to map who gains and who pays.
July 28, 2026
Distributional Analysis: A Practical Guide for Land Reform
Distributional analysis explained for tax and land reform. Learn the methods, data, and workflows used to map who gains and who pays.
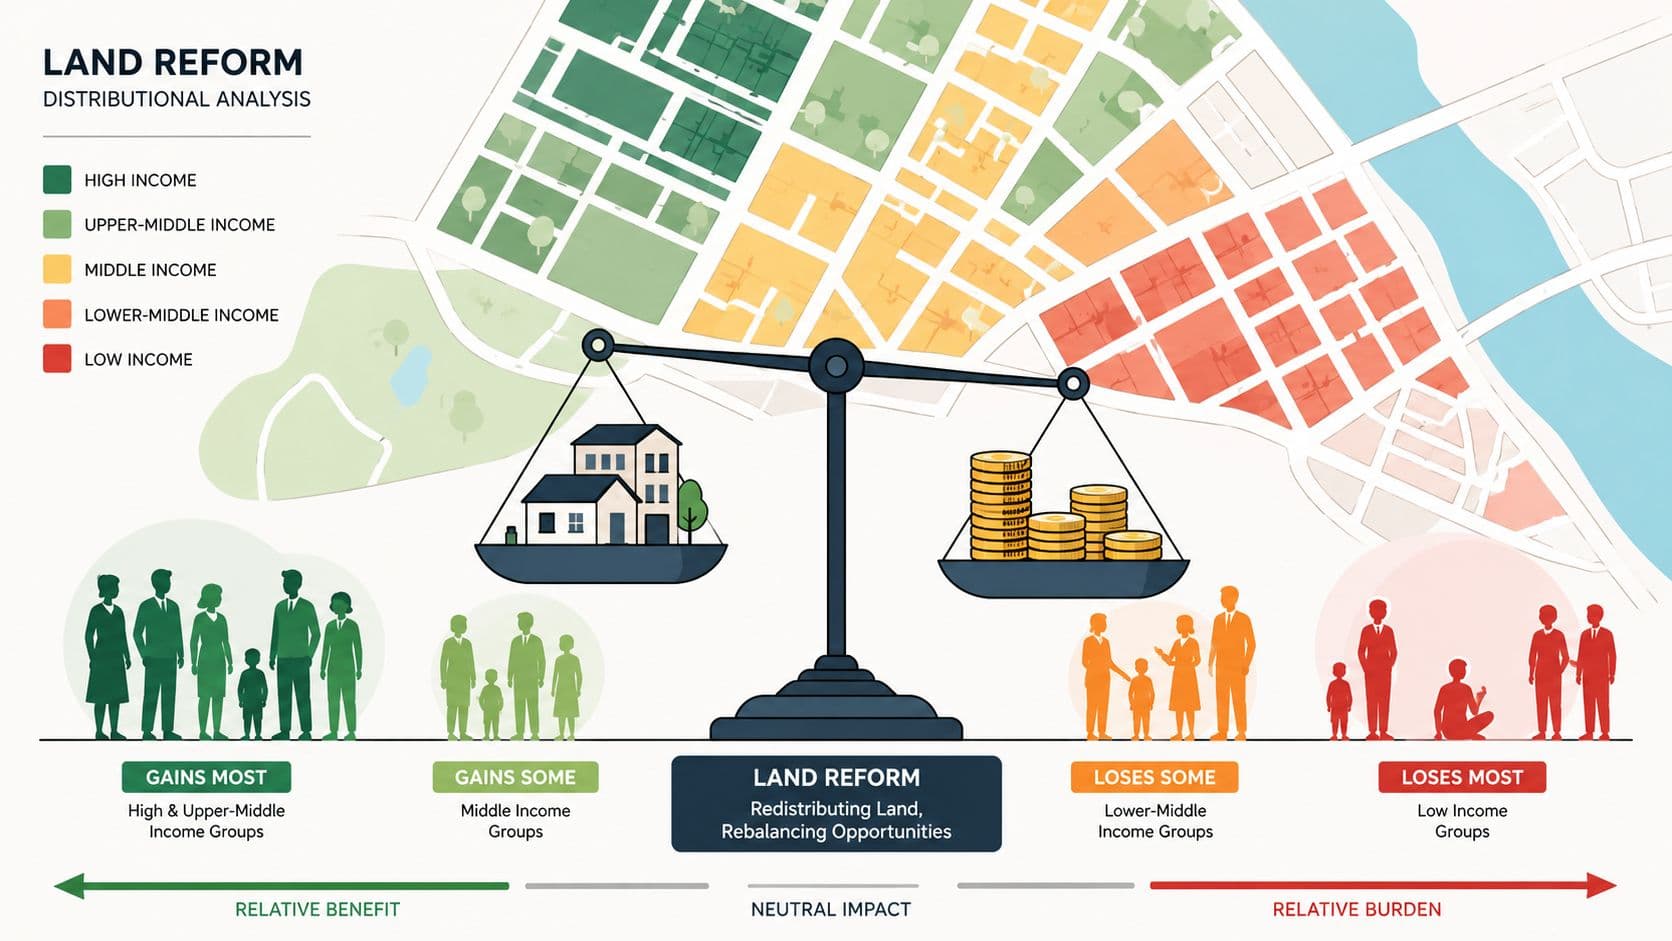
You can see the politics of distributional analysis in almost any reform meeting. One group worries it will pay more, another expects to gain, and someone in the room insists the average effect is all that matters. That's exactly where average-only thinking fails, because a reform can look neutral in the aggregate while shifting a real burden onto owners, tenants, workers, or specific regions.
For a finance ministry or city government, the practical question is simple. If a land-value tax, a property reform, or a subsidy change lands on the table, who pays, who benefits, and who gets squeezed in the middle? The answer starts with distributional analysis, which means mapping an outcome across a population and then separating the affected, increased, and decreased subpopulations before you summarize anything (Social Security guidance).
That structure matters even more in land and tax reform, because the burden can move through ownership chains and into asset prices. A proposal can look tidy on paper and still create concentrated gains for one group and concentrated losses for another. In that setting, distributional analysis is less a fairness check than a way to build an evidence base for design, transition rules, and compensation.
Table of Contents
- What Distributional Analysis Actually Does
- Core Methods Behind Distributional Analysis
- Data and Modelling Requirements You Cannot Skip
- Applying Distributional Analysis to Land Reform
- Real-World Precedents and What They Show
- Communicating Results to Policymakers and the Public
- Best Practices and Policy Implications
What Distributional Analysis Actually Does
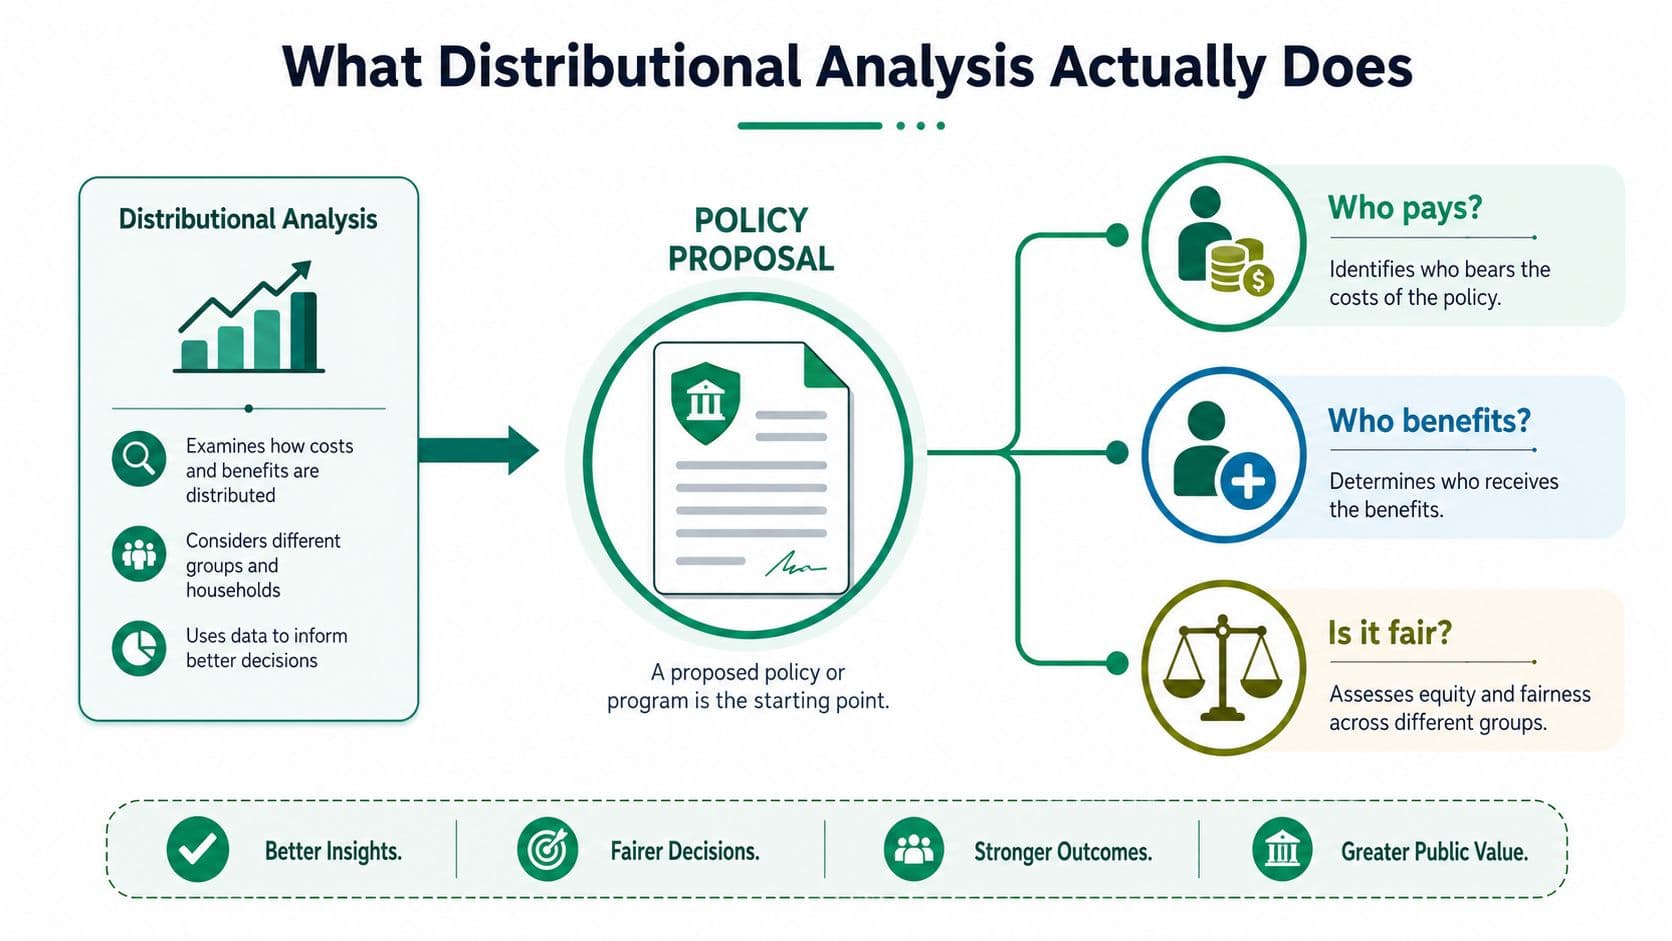
A land-value tax proposal can sound tidy in a cabinet room and feel very different at a neighborhood meeting. Finance officials may focus on revenue, property owners worry about the bill, tenants ask whether rents will shift, and planners want to know which districts will feel the pressure first. Distributional analysis turns that argument into a structured map of who gains, who loses, and by how much.
The Social Security Administration's research guidance defines distributional analysis as examining how an outcome such as income, benefits, or height is spread across a population, and it recommends building the affected, increased, and decreased subpopulations before calculating summary measures (SSA guidance). The logic is straightforward. If you only report the average effect, you can miss the people who pay more, the people who gain, and the groups that need protection during transition.
Start with the policy problem, not the spreadsheet
A finance ministry should begin with the policy question. A city may want to know whether a land-value tax shifts the burden away from buildings and onto landowners, while a finance ministry may want to know whether a reform is regressive, progressive, or concentrated in one region. The Mercatus Center draws the same line clearly, saying benefit-cost analysis asks whether total benefits exceed total costs, while distributional analysis shows who receives the benefits and bears the costs, including transfers (Mercatus).
That distinction matters because land and tax reform often creates winners and losers inside the same headline number. An aggregate increase in welfare or revenue can still hide a localized loss for homeowners, a gain for developers, or a shift in burden from one district to another. The analyst's job is to surface that pattern before ministers commit to a design.
Practical rule: if the reform touches land, housing, or taxes, ask about incidence before you ask about totals.
The phrase is technical, but the idea is simple. It means tracing the path of the burden. If a policy shifts costs through landlords to tenants, or through developers to buyers, the initial payer is not always the final bearer. That is why a guide focused on land and tax reform needs a stricter standard than a generic fairness check, especially where rent-seeking incentives shape who captures the gains, as explained in this overview of rent-seeking in economics.
Why aggregate averages mislead
Averages are useful, but they flatten the differences ministers need to see. The Australian Government's Office of Impact Analysis says distributional analysis should identify stakeholder groups, allocate quantified costs and benefits, consider whether impacts shift to other groups, and address uncertainty (OIA guidance). The government should not stop at a single total. It should ask which groups are on each side of the ledger, and whether the burden travels after the first round of effects.
That matters because land reform often changes behavior over time. Owners may delay selling, tenants may face pass-through costs, and localities may see different outcomes depending on housing supply or redevelopment pressure. A clear distributional frame keeps those effects visible instead of burying them inside an average. For land-based policy, the hard part is that gains and losses can be capitalized into asset prices, so the immediate tax bill may look small while the impact sits inside housing wealth.
A practical way to read the results is to separate flow effects from stock effects. Flows are the taxes paid, the rents charged, or the transfers received. Stocks are the underlying asset values that may rise or fall as the market adjusts. In land reform, the second layer often matters as much as the first, because capitalized changes can leave households feeling better or worse off even when their annual cash flow changes only a little.
For a reader trying to separate the concept from the method, that is the simplest test. If a reform brief only tells you whether revenue rises or falls, you do not yet have distributional analysis. If it tells you which groups gain, which groups lose, and how the burden changes across the population, you do.
A policy note built from document extraction with pdf-parser can help analysts pull those group-level effects from technical papers and consultation submissions without losing the burden-shifting logic. The broader policy conversation is easier to manage once that distinction is clear, because it shows when microsimulation is needed, when incidence tracing is enough, and when a wider benefit-cost lens should sit alongside both.
Core Methods Behind Distributional Analysis
The methods matter because distributional analysis is not one technique. It is a family of tools that answer different questions, and confusing them leads to sloppy policy advice. A finance ministry that wants to understand a land reform needs to know which households are affected, which group ultimately pays, and whether the total package still makes sense on efficiency grounds.
Microsimulation and incidence are not the same thing
Think of microsimulation as a virtual laboratory. The Yale Budget Lab describes a standard workflow that models each individual or household, assigns people to groups such as income or age, and then computes group-level summary measures of policy effects (Yale Budget Lab). That is especially useful when a reform hits many people differently, because you can compare outcomes before and after the policy without forcing everyone into one average bucket.
Incidence analysis is narrower. It asks who ultimately bears the burden or receives the benefit after the initial policy action has worked through the economy. In a land tax setting, that distinction matters because the legal payer may not be the economic bearer. A landlord may receive the bill, but part of the cost can show up through rents, sale prices, or lower land values depending on market conditions.
Fiscal incidence and benefit-cost work answer different questions
Fiscal incidence is easiest to explain with a restaurant bill. The person at the table who hands over the card is not always the same person who enjoys the meal or who ends up contributing once the check is split informally. A tax system works in a similar way. The entity that remits the payment is not always the one that bears the final burden, which is why fiscal incidence tracks where the cost lands after behavior and market adjustments.
Benefit-cost analysis is the complementary tool, not the substitute. It asks whether the reform's total benefits exceed its total costs, while distributional analysis asks who gets what share of those gains or losses. The Australian Office of Impact Analysis explicitly recommends allocating quantified costs and benefits to stakeholder groups and then checking whether incidence shifts across them (OIA guidance note). That means the two methods should sit side by side, not compete with each other.
A good brief tells ministers both the size of the pie and how the slices are cut.
For researchers who need to move from scanned papers to structured evidence, a practical tool like document extraction with pdf-parser can help pull tables and incidence notes out of source documents before the modeling work begins. That kind of document handling does not replace analysis, but it saves time when the underlying evidence is buried in lengthy PDFs.
Matching method to question
The choice is straightforward once the reform question is clear.
- Microsimulation fits household-level reforms, especially when the policy has many interacting parameters.
- Incidence analysis fits questions about who bears a tax, fee, or subsidy change.
- Fiscal incidence fits public finance decisions where legal liability and economic burden may diverge.
- Benefit-cost distribution fits the broader judgment about whether the reform is worth doing at all.
That mapping becomes even more important when analysts need to compare land reform with revenue forecasting, because the revenue total alone won't tell you whether the burden falls on owners, tenants, or downstream users. For that kind of work, internal modeling discipline matters as much as the headline estimate, which is why analysts often pair distributional work with a separate revenue model such as revenue forecasting models.
The core lesson is simple. Use microsimulation when you need individual-level detail, incidence when you need burden tracing, fiscal incidence when legal and economic payers differ, and benefit-cost distribution when the ministry needs the full policy case. If you use the wrong tool, the reform brief may still look polished, but it won't answer the question the minister is asking.
Data and Modelling Requirements You Cannot Skip
A credible distributional result starts with data that can answer the policy question, not with the model alone. For land and tax reform, one dataset rarely covers the full chain of effects. Household surveys show income and demographics, tax records show liabilities, property registers show ownership and assessed value, and cadastre layers help locate parcels and boundaries. If the reform touches housing or land, analysts usually need more than one source to see who gains, who loses, and where the burden may be hidden.
Build the base case before the reform case
The modelling sequence should stay disciplined. Start with a baseline that represents the status quo, then define the counterfactual reform case. Only after that should analysts ask how owners, tenants, developers, and nearby households respond. The workflow used by the Yale Budget Lab, which simulates at the individual level and then groups people for summary results, gives a clear model for this logic.
That sequence matters because policy effects are not just arithmetic. People change behaviour. They may alter development plans, defer transactions, or pass costs on to other parties. A clean counterfactual keeps those responses visible instead of folding them into the policy effect itself.
Match the summary statistic to the shape of the data
Distributional analysis is nonparametric in spirit, so the analyst should respect the shape of the data rather than force it into a neat formula. The technical literature notes that the unit of analysis is a probability distribution, and that the space of distributions is convex but not a vector space, so ordinary Euclidean subtraction does not carry over cleanly (distributional data analysis overview). In practical terms, two distributions are not two simple numbers, and the algebra does not work as if they were.
That is why summary statistics need to match the pattern of the data. The Australian Government's guidance says analysts should separate shape, center, spread, and outliers, and for skewed data it prefers the median and interquartile range over the mean and standard deviation (OIA guidance note). Land and housing markets are often skewed, so a few very large assets can pull the mean away from what most affected properties look like.
If the distribution has long tails, the average can be a liar.
That does not make means useless. It means they belong only where they fit the data structure in front of you. For a finance ministry, the point is reliability, not elegance.
A final check is uncertainty. Good distributional work does not pretend the data are perfect or the behavioural response is known with certainty. It states what is measured directly, what is modelled, and where the confidence interval is wide. That makes the final numbers more credible, not less.
The treatment of land value needs a separate measurement step. If the policy depends on parcel-level gains or losses, analysts should calculate land value carefully, using a method that can separate land from structures and trace value changes back to the right asset. A practical starting point is how to calculate land value, because the incidence question is much clearer once the underlying asset is measured in the right unit.
Applying Distributional Analysis to Land Reform
A land reform proposal rarely behaves like an ordinary tax or transfer. A benefit can usually be traced to a household in cash terms. A change to land policy often works through a different channel, because gains may be capitalized into asset prices, passed through rental markets, or stored inside housing wealth. Analysts need to treat that hidden incidence carefully, or a simple decile chart will give a misleading picture.
Define scope and groups first
The first step is scope. A ministry needs to say which policy lever is being assessed, which groups it touches, and over what horizon the effects should be judged. A tax on unimproved land value is not the same as a redevelopment charge, and both differ from a reform of land-use rights. If the policy is a recurring land charge, the analysis should be built around owners, tenants, nearby residents, and the public sector.
The second step is stakeholder mapping. The Australian Office of Impact Analysis advises analysts to identify the groups that gain or lose, assign quantified and qualitative costs and benefits to those groups, and consider whether impacts shift elsewhere. In land reform, that usually means owners, tenants, developers, workers, and public beneficiaries. The grouping should follow the policy design, not routine habit.
Choose the grouping unit with care
Income is often the default grouping, but it should not be automatic. The U.S. Congressional Budget Office says its distributional analysis examines outcomes across age or birth cohort, educational attainment, income or wealth, race and ethnicity, and sex (CBO distributional analysis). That list is a useful reminder that subgroup analysis is not limited to income.
For land reform, tenure status and geography can be more revealing than income alone. A low-income renter in a high-pressure redevelopment area may face a very different exposure from a low-income household in a stable district. If the analyst only uses income bins, the distributional story can miss location-specific burden entirely.
Allocate direct and shifted impacts
The next step is to allocate costs and benefits by group, then ask whether any part of the burden shifts. That is where incidence becomes practical. A tax may be levied on landowners, but the burden can partly shift through market prices. A public investment may raise nearby land values, but the gain can be absorbed into asset prices rather than current cash income.
Land-use rights need separate treatment from land-value taxes. Land-value taxes tax the unimproved value of land. Land-use rights are land leases repriced annually with no expiration dates, and because they are repriced annually, people can buy and sell them for a low cost. That structure creates distributional effects that a generic tax model can miss, because the burden and the liquidity profile differ from a standard property tax change. The distinction is clearer when set against land value tax vs property tax.
For land valuation work, it helps to cross-check the policy mechanics against a dedicated valuation frame such as calculate land value. Once the underlying asset is measured in the right unit, the incidence question becomes easier to follow.
The core discipline is simple. Define the scope, map the groups, justify the grouping unit, allocate direct and shifted impacts, and report uncertainty without hiding it. That may feel slow, but land reform is the kind of policy where slow analysis prevents fast mistakes.
Real-World Precedents and What They Show
The best precedents are useful because they show that distributional analysis changes with the institutional design. A mature land tax, a leasehold system, a resource dividend, and a property-tax experiment all tell different stories. The headline revenue number matters, but the grouping unit usually tells you more.
Mature systems show how incidence settles
Denmark's long history of land taxation is useful because it shows how a settled system can still be examined through owners and tenants rather than through one broad average. The distributional question there is not just whether the tax raises revenue. It is how the burden sits across housing arrangements and asset holders, and how that burden is communicated in a system people have learned to live with over time.
Estonia offers a different lesson. Its land tax transition is often discussed in relation to how reform was communicated and how distributional findings shaped compensation design. That is the practical point. Even a straightforward land tax can require transition measures if the burden is concentrated in groups that cannot absorb it immediately.
Leasehold systems look like land-use rights in practice
Singapore is especially important because its leasehold structure resembles a large-scale land-use right regime. Annual repricing changes the way households and firms experience the policy compared with a one-off land-value tax. The distributional effect depends on how the lease is reset, how long the household expects to remain, and how asset prices capitalize the future stream.
That is why this example matters to a finance ministry. The question is not only who pays this year. It is who can enter the market cheaply, who faces repricing risk, and how much of the policy shows up in the asset value rather than current cash flow.
Public dividends and local tax variants broaden the frame
Alaska's Permanent Fund dividend is a reminder that resource rents can be redistributed directly to residents rather than retained entirely by the fiscal system. Canberra's rating system and Norway's wealth and property taxes show how different tax bases can produce different incidence patterns, even when the policy language sounds similar. Allentown's two-rate property tax experiments in Pennsylvania add a local illustration of how shifting the tax mix changes behavior and the burden across property types.
| Jurisdiction | Reform | Primary Grouping | Distributional Finding |
|---|---|---|---|
| Denmark | Long-running land taxation | Owners and tenants | Incidence is clearer when the analysis separates housing arrangements rather than using one aggregate average |
| Estonia | Land tax transition | Owners and compensation groups | Transition design matters because concentrated losses can shape acceptance |
| Singapore | Leasehold and repricing system | Tenure and income | Annual repricing produces effects that differ from a one-time land-value tax |
| Alaska | Permanent Fund dividend | Residents | Resource rents can be distributed directly rather than retained in the tax base |
| Canberra | Rating system | Property type and location | The burden depends on local assessment structure, not just the headline rate |
| Norway | Wealth and property taxes | Wealth and property holders | Grouping by asset exposure reveals effects that income alone can miss |
| Allentown | Two-rate property tax experiments | Building and land holders | Changing the tax base alters incentives and the distribution of burden |
If you need a deeper example set, the precedent list on District of Columbia homestead exemption is a useful reminder that targeted relief can soften distributional pressure without redesigning the whole tax.
The common lesson is simple. The story changes as soon as you change the grouping unit. If you sort by income, you get one answer. If you sort by tenure, geography, or asset type, you often get a more realistic one.
Communicating Results to Policymakers and the Public
A technically correct distributional table can still fail if nobody can read it. Ministers want the short version, legislators want the political tradeoffs, journalists want the conflict, and citizens want to know whether they are likely to pay more. The analyst's job is to keep the precision without making the result unreadable.
Separate the briefing from the public summary
A Treasury briefing should carry subgroup tables, assumptions, and uncertainty ranges. It should say which population was analyzed, which costs were allocated directly, and where the incidence is modeled rather than observed. A public-facing summary should use plain language, such as which groups are likely to gain, which groups may lose, and what the transition plan does about it.
Charts help, but only if they do not hide the distribution. A simple graphic showing the change in tax burden by income group is often more persuasive than a dense table. If the analysis includes land or tenure splits, those charts should appear too, because income alone can blur the policy reality.
Report uncertainty without losing trust
Uncertainty should be visible, not buried. Analysts should say when results depend on assumptions about pass-through, behavior, or asset-price capitalization. That honesty protects the ministry from overpromising and gives ministers a better basis for staged implementation.
Good visualization practice matters here as well. If the chart is cluttered, people infer confusion, even when the numbers are sound. A practical guide like Encelade's data visualization best practices is useful because it reinforces a simple rule, the chart should clarify the distribution, not decorate it.
Don't make the chart do the policy argument for you, make it do the reading for you.
Expect the politics to move with the framing
Distributional results are often weaponized by interest groups. Owners may emphasize gross tax bills, while supporters of reform may emphasize long-run gains or average efficiency. The discipline is to report both intended and unintended effects, because a reform that hides its losers invites a stronger backlash later.
That is why communication is part of design, not an afterthought. If ministers know the subgroup effects early, they can phase the policy, target relief, or redesign the tax base before the reform becomes a public fight. The analysis may start in a spreadsheet, but it survives or fails in the way it is explained.
Best Practices and Policy Implications
A useful land-reform brief starts by doing the hard work first. It defines the population before anything else, explains why that grouping unit is the right one, separates direct incidence from shifted incidence, tests the behavioral assumptions, and reports uncertainty in a form ministers can use. It also treats capitalized land-value changes as distributional effects in their own right, rather than as background noise buried inside housing wealth.
The part many guides leave out is capitalization. If a public action raises land values and the gain is quickly absorbed into asset prices, a cash-income-only view will understate who benefits and who bears the cost. A serious distributional analysis for land reform has to combine microsimulation with an explicit treatment of capitalization, or it will miss the households that gain on paper, the households that are priced out, and the way wealth shifts through the asset market.
Land policy often works like a ripple through a pond, except the ripple shows up first in prices. The policy may look mild in a payroll or transfer ledger, yet still change the value of the underlying asset and alter the distribution of wealth across owners, buyers, and renters. That is why the analyst has to ask a simple question before declaring success. Where does the policy show up, in cash flow, in rents, or in the land price itself?
The payoff from better incidence work is practical. Ministers can use it to design targeted compensation, phase in the reform more smoothly, and build transition paths that people can see and understand. It also gives them a clearer basis for public explanation, which often determines whether a reform is treated as fair adjustment or as a giveaway to owners, or as a hidden tax on tenants.
The checklist is straightforward. Define the population, choose the grouping unit carefully, assign direct and shifted effects, test sensitivity, and show uncertainty plainly. If the reform touches land, add one more test, ask how asset prices will absorb the policy before the ministry announces victory. That is what separates an average-only model from a reform brief that can survive scrutiny and still be implemented.