Learn how quality of life measurement works, the indices that matter, and how to design indicators for land-value and fiscal policy.
September 9, 2026
Quality of Life Measurement: A Practical Policy Guide
Learn how quality of life measurement works, the indices that matter, and how to design indicators for land-value and fiscal policy.

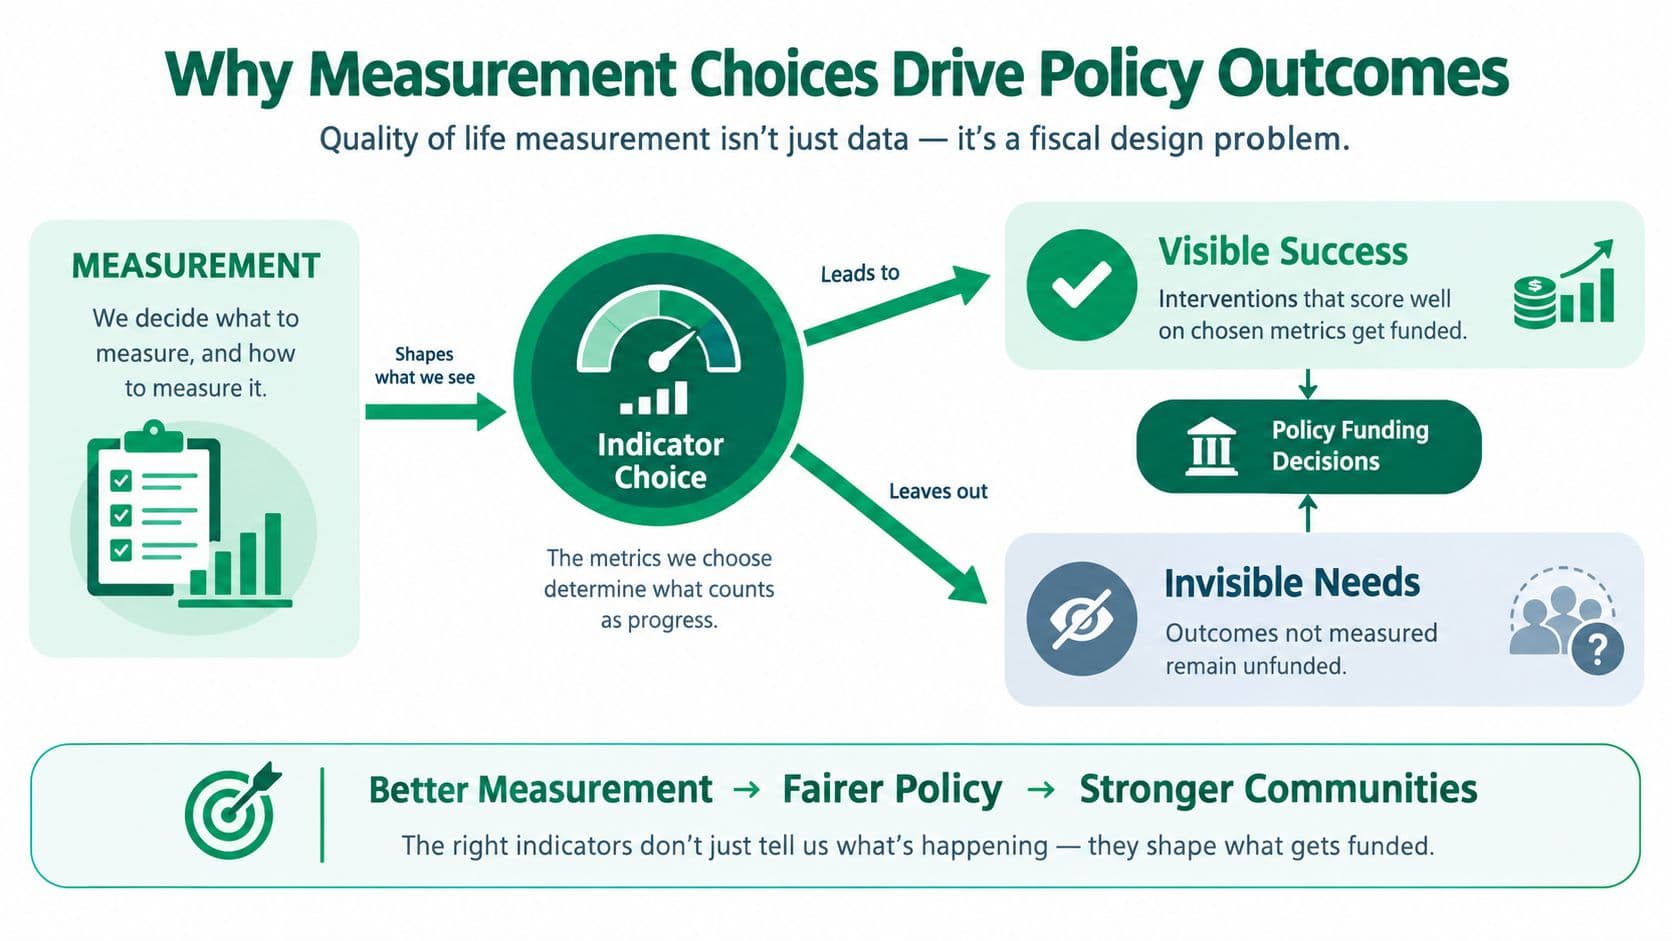
Most guides treat quality of life measurement as a neutral ranking exercise. That advice is incomplete. An indicator system is a fiscal-policy choice, because the measures a government selects determine which problems become visible, which interventions appear successful, and which groups disappear inside an average.
The practical question isn't whether residents report satisfaction or whether a city has adequate infrastructure. It is whether the measurement system can connect lived experience, material conditions, land values, public services, and distributional effects to decisions a finance ministry can take. More indicators won't solve that problem automatically. Without a clear policy purpose, a larger dashboard can make trade-offs harder to see.
Table of Contents
- Why Measurement Choices Drive Policy Outcomes
- Subjective and Objective Indicators Explained
- Major Indices Compared and What They Miss
- Survey Instruments and Domain-Level Scoring
- Land Leases vs Land-Use Rights in Indicator Design
- Place-Based Indicators for Fiscal Policy
- Building a Measurement System That Works
- Case Studies and Documented Precedents
Why Measurement Choices Drive Policy Outcomes
A jurisdiction can collect extensive data and still make poor decisions. The reason is simple: measurement systems don't merely describe outcomes, they allocate attention. If a budget framework tracks hospital access but not housing insecurity, spending that improves the former may look more successful than a policy addressing the latter. If it records average income but not who bears land costs, a revenue reform can appear broadly beneficial while imposing pressure on particular tenants or neighborhoods.
Quality of life measurement became a formal research field in the 1960s, when researchers began using objective social, economic, and health indicators to assess whether human needs were being met. Medical instruments designed specifically for quality of life appeared in 1970, including the Vitagram Index and Life Units. A widely popular scale followed in 1976, Priestman and Baum's Linear Analogue Self Assessment Scale. This history, documented in the Yale Medical Library dissertation, shows the field's movement from broad welfare concepts toward operational tools.
Indicators embed a theory of value
Every indicator answers a prior question: what counts as improvement? A finance ministry focused on productivity may prioritize employment, transport access, and investment. A health ministry may emphasize functional status and mental health. A city government may care more about safety, belonging, environmental exposure, or access to schools.
The danger lies in presenting these choices as neutral. Before recommending land-based revenue instruments or service-spending reforms, analysts should identify the outcome being protected, the population being assessed, and the mechanism through which public action is expected to change that outcome. A practical guide to policy evaluation methods helps make that causal chain explicit.
Land tenure makes the problem more consequential. Residents holding freehold interests, fixed leases, renewable leases, or indefinite land-use rights can experience the same public investment differently. A new transit connection may raise nearby land values, improve mobility, increase rents, or change a household's sense of security. A city that measures only average property values can record the gain while missing the distributional effect.
Practical rule: Treat indicators as decision tools, not as a league table. A good measure tells officials what changed, for whom, and which policy lever could plausibly have caused it.
Subjective and Objective Indicators Explained
Consider a household financing a home through a 30-year mortgage. Its objective circumstances can be described through measurable facts such as the purchase price, interest rate, floor area, repayment burden, employment status, and distance to services. Administrative records, market data, cadastral systems, and spatial datasets can capture much of this information without asking the household how it feels.
Yet those facts don't fully describe quality of life. The same household may report financial strain because the mortgage feels insecure, even if repayments remain current. Another household with similar housing costs may report greater satisfaction because it expects to remain in the neighborhood and trusts local institutions. Subjective indicators capture the resident's judgment, including life satisfaction, perceived safety, financial stress, housing satisfaction, and belonging.
Use both perspectives deliberately
The UNECE guidelines on measuring well-being distinguish objective indicators, such as income, air pollution, child mortality, hospital beds, and employment, from subjective indicators based on how people evaluate their lives. The distinction isn't cosmetic. It lets analysts identify mismatches between conditions and perceptions.
A housing-finance evaluation might proceed in three stages:
- Establish material conditions. Use property records, rental information, mortgage data, building characteristics, service-access maps, and environmental data to describe the household's external circumstances.
- Measure lived experience. Use a consistent survey instrument to ask about satisfaction, safety, financial strain, security, and neighborhood stability. Self-reported ladder scales can capture overall life evaluation, but domain questions provide more diagnostic detail.
- Compare the signals. If objective housing conditions worsen before satisfaction declines, officials may have an early warning. If conditions remain stable while perceived security falls, the policy response may need to address expectations, trust, social cohesion, or tenure risk.
This pairing is especially important when assessing land-value capture. Market data can show that a public improvement has increased site value, while residents report displacement pressure or weaker neighborhood stability. Treating subjective data as “soft” would remove a relevant cost from the policy appraisal.
The same principle applies to environmental valuation. Analysts assessing the public benefits of parks, wetlands, or accessible green space can use ecosystem service valuation alongside resident perceptions. Cost-benefit analysis becomes weaker, not stronger, when it counts physical assets but ignores how people experience them.
Major Indices Compared and What They Miss
International indices answer different policy questions, even when they all use the language of development or well-being. The Human Development Index, introduced by the United Nations Development Programme in 1990, combines three dimensions: a long and healthy life, knowledge, and a decent standard of living, as described by the United Nations Development Programme. Its strength is conceptual clarity. Its limitation is that a national composite can conceal unequal access to those achievements.
Subjective well-being indices begin from a different premise. The World Happiness Report 2024 ranks countries using nationally representative responses to a single life-evaluation question scored from 0 to 10, with rankings calculated from a three-year average of each population's assessment. The report also highlighted long-term movements, including Serbia rising 69 places and Bulgaria 63 places since first being measured in 2013. These results demonstrate that national well-being rankings can change substantially over time, but they don't explain which fiscal intervention produced the movement.
The Genuine Progress Indicator, or GPI, is often used as a corrective to GDP because it can account for unpaid labor, distributional effects, and environmental depreciation. Its policy value lies in broadening the accounting frame. Its challenge is methodological consistency, because valuation choices and available data can differ across jurisdictions.
| Dimension | HDI | GPI | Subjective Wellbeing |
|---|---|---|---|
| Primary question | Are people living longer, learning, and enjoying material standards? | Does economic activity translate into broader social progress after costs and benefits are counted? | How do people evaluate their lives? |
| Fiscal signal | Supports investment in health, education, and productive capacity | Supports spending that protects social and environmental value | Reveals perceived insecurity, stress, belonging, and satisfaction |
| Main blind spot | Distribution within national or regional averages | Comparability and valuation assumptions | Adaptation, cultural response patterns, and limited causal explanation |
| Populations most easily missed | Groups excluded by average income, education, or health results | Unpaid carers, environmentally exposed communities, and groups affected by distributional shifts when data are weak | People whose material deprivation is normalized or whose expectations differ from survey norms |
Match the index to the decision
HDI can support an investment-led strategy, but it won't tell a treasury whether land speculation is shifting gains toward owners while households face rising housing costs. GPI can expose unpaid care and environmental losses, but it shouldn't be treated as a universal substitute for administrative accounts. Subjective well-being can reveal housing stress invisible in both, yet it needs objective evidence to identify causes.
The strongest conclusion isn't that one index should win. Each index is a lens with a fiscal use case and a predictable blind spot. A ranking becomes useful only when officials can connect its movement to a defined population, a budget decision, and a plausible mechanism.
Survey Instruments and Domain-Level Scoring
Finance and health ministries often encounter two established health-related quality-of-life instruments, WHOQOL-BREF and SF-36. They don't measure the same construct, and their outputs shouldn't be collapsed casually into one headline score.
The World Health Organization's WHOQOL instruments define quality of life as an individual's perception of their position in life within the context of culture, goals, expectations, standards, and concerns. WHOQOL-BREF organizes that perception across four domains, physical health, psychological health, social relationships, and environment. The WHO-linked guidance generally discourages treating one global score as the primary result, because the domains are intended to be interpreted separately.
SF-36 takes a more function-oriented approach. It contains 36 items and covers eight domains, including physical functioning, pain, general health, vitality, social functioning, role limitations, and mental health. The instrument is valuable when officials need to understand how health affects daily activity, but its structure isn't a complete measure of housing, neighborhood, or environmental quality.
Why domain scores matter to budgets
A composite can remain stable while its components move in opposite directions. Residents may report better physical functioning alongside worse social relationships or environmental satisfaction. If a ministry uses only the composite, it may conclude that no significant intervention is required. Domain-level results can point instead to mobility access, housing affordability, environmental exposure, or social isolation.
| Dimension | WHOQOL-BREF Domains | SF-36 Domains |
|---|---|---|
| Physical condition | Physical health | Physical functioning, bodily pain, general health |
| Psychological or mental condition | Psychological health | Vitality, mental health |
| Social dimension | Social relationships | Social functioning, role limitations |
| Environment and daily context | Environment | No equivalent broad environmental domain |
| Main policy use | Perceived quality of life across life context | Health-related functioning and limitations |
Survey collection also needs operational discipline. Teams designing questionnaires may find it useful to migrate from Google Forms to Kiwiform when they need a more structured workflow for collecting and organizing responses. The software choice matters less than preserving wording, sampling logic, response scales, and data vintages across reporting cycles.
For broader policy appraisal, a value map can help connect domain results to places, assets, and affected groups. The central rule is straightforward: retain the disaggregated outputs before producing any composite. A single number can summarize a system, but it can't explain which lever needs funding.
Land Leases vs Land-Use Rights in Indicator Design
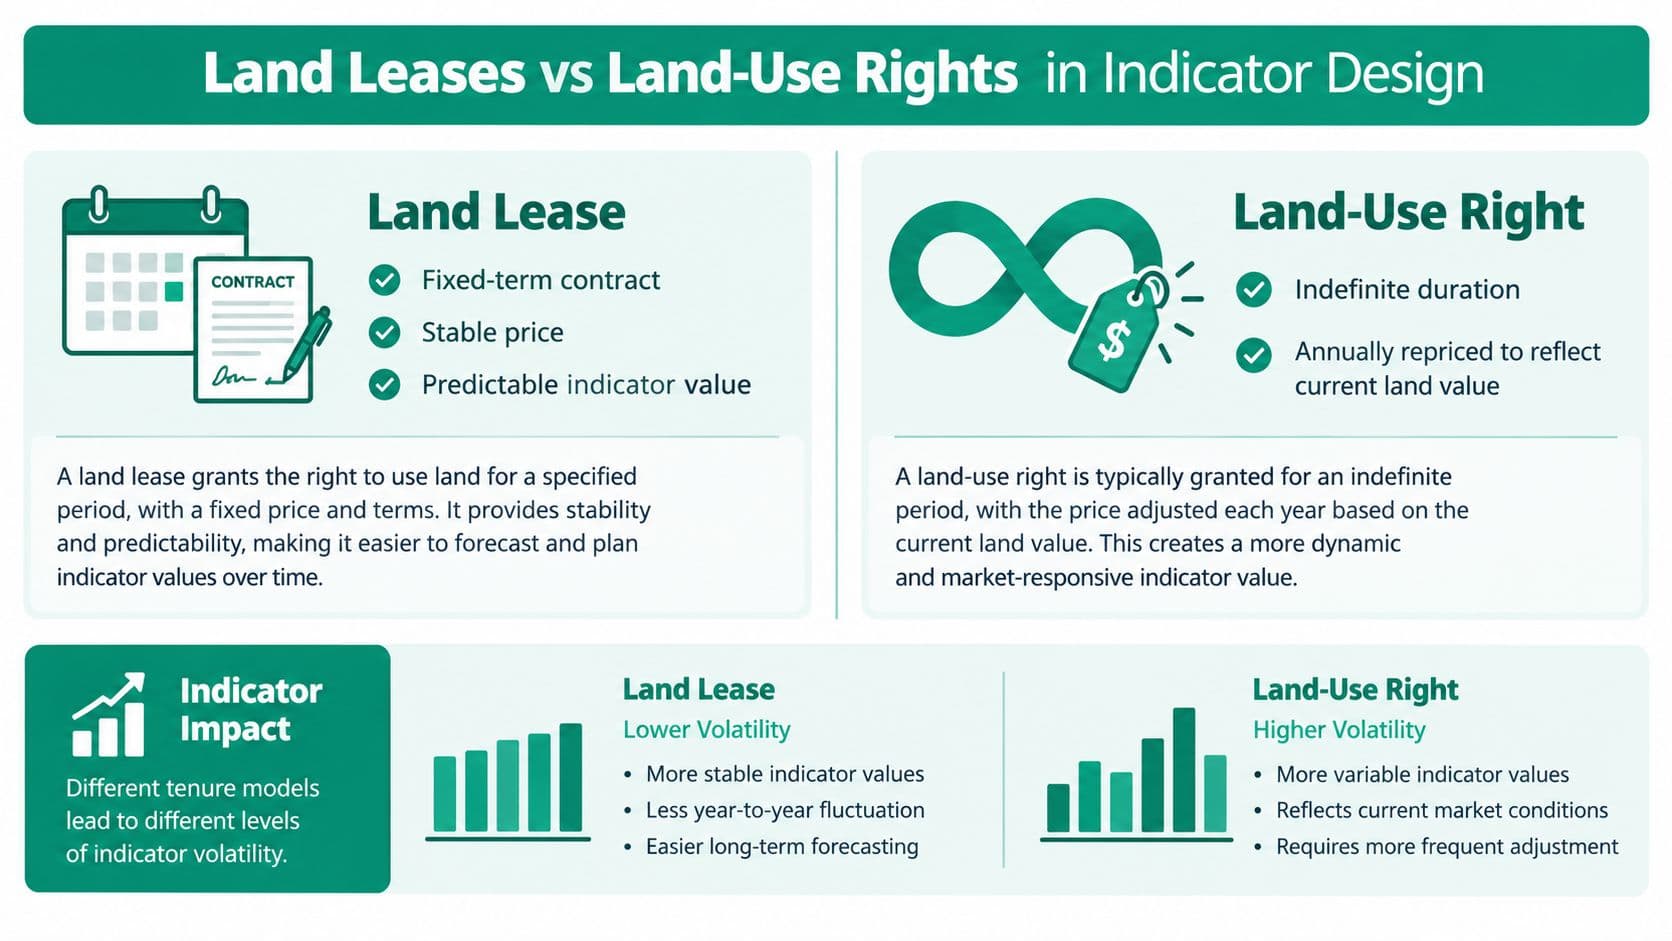
Land leases and land-use rights can look similar in a property register while producing very different fiscal signals. A land lease is a fixed-price agreement for a defined term. It may be renewable or non-renewable, but the fixed price doesn't continuously adjust to the current value of the land.
A renewable lease provides certainty only until its term ends. When the lease rate falls behind the market, the accumulated gap can be closed through a major repricing at renewal. A non-renewable lease becomes progressively harder to refinance and sell as its remaining term shortens. Fixed leases don't correctly price risk. They postpone it.
A land-use right, as used here, is different. It has no expiration, requires no renewal, and is repriced annually. That annual repricing allows people to buy and sell the right at low cost while keeping the payment connected to current land value. Sometimes fixed leases are called “land-use rights”, but that label is incorrect unless the arrangement meets all three criteria.
The measurement consequences
Under an annually repriced, indefinite right, changes in land value can appear as a continuous signal. A new transit route, school, or commercial cluster may be reflected through updated site values. Under a fixed lease, the recorded payment can remain unchanged while market conditions move, creating a lag between neighborhood change and fiscal data.
That lag affects quality of life measurement. A dashboard might show stable lease revenue even as land values rise and public investment creates private gains. Conversely, a renewal event can create a sudden financial shock that appears to be a change in household welfare, although the underlying land productivity may have changed gradually.
Officials reviewing tenure arrangements should first decode land use regulations and then classify the payment mechanism precisely. The distinction is also central to 99-year land leases, because a long fixed term still isn't an indefinite, annually repriced land-use right.
Subjective surveys add another layer. Residents may feel less secure when a lease approaches expiration even if local services remain strong. Conversely, an indefinite right may support stable expectations while objective land values rise. Indicator design must therefore record tenure structure, not merely tenure labels, when interpreting housing stress, investment, mobility, and neighborhood satisfaction.
Place-Based Indicators for Fiscal Policy
National averages are poorly suited to decisions about land-value capture. A national life-satisfaction result can't tell a municipality which underused site is blocking housing supply, which neighborhood lacks service access, or which public investment has increased location value.
UN-Habitat's 2025 global city dataset and implementation guidance broadens quality of life measurement toward local benchmarking, diagnostic use, transparent reporting, and community engagement, as described in its quality-of-life initiative materials. Eurostat's quality-of-life methodology likewise distinguishes objective situations from subjective perceptions and supports combining both within one framework.
Select indicators a revenue instrument can move
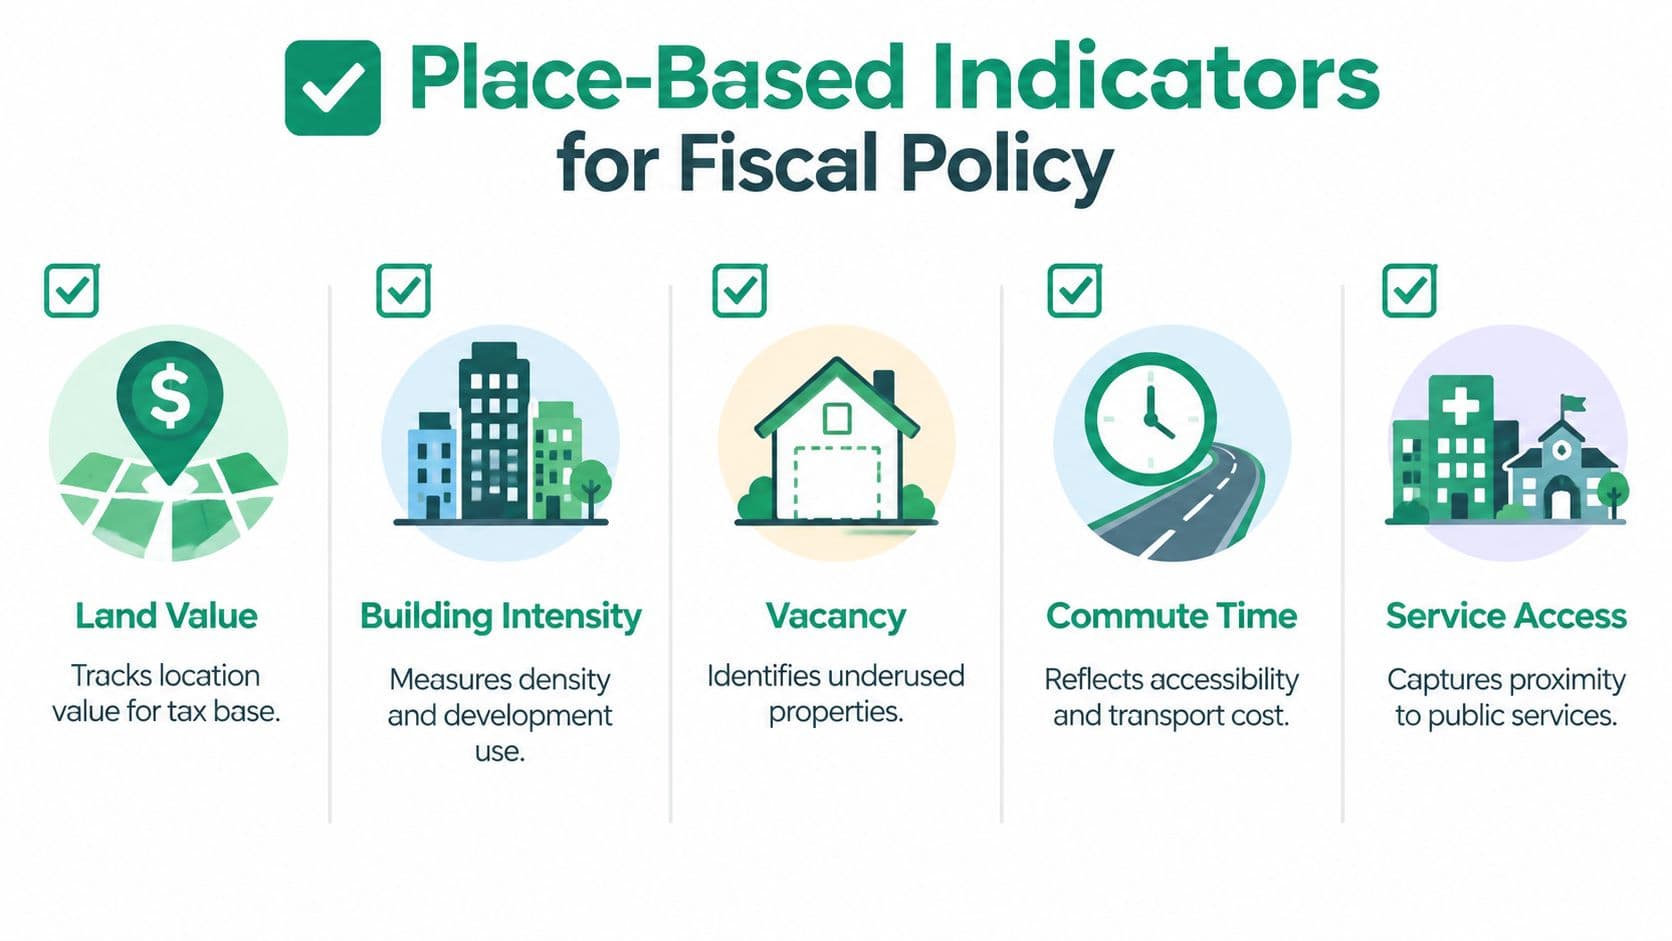
A place-based dashboard should connect each measure to a budget line or revenue mechanism. Useful candidates include:
- Land value: Tracks the location component of the tax or charge base.
- Building intensity: Shows whether permitted development potential is being used.
- Vacancy: Identifies properties that remain underused despite service access.
- Commute time: Captures accessibility and the transport burden associated with location.
- Service access: Connects public investment to proximity to schools, hospitals, transport, and other facilities.
Resolve the geography before interpreting the result
Small-area analysis can expose trade-offs hidden by citywide means, but survey data may become unreliable where populations are too small for reliable inference. The practical response isn't to abandon local measurement. It is to combine resident surveys with administrative records, cadastral information, transport networks, environmental layers, and other spatial data.
A neighborhood can have strong infrastructure and weak belonging. Another can report high satisfaction while facing material deprivation that residents have adapted to. These combinations produce different policy responses. Place-based measurement is a fiscal necessity because land values, service access, and housing pressure are spatially specific.
Building a Measurement System That Works
A workable system begins with the fiscal question, not with the available dashboard. Officials should ask whether they're evaluating service allocation, land-value capture, housing affordability, environmental investment, or distributional effects. That choice determines the relevant population, geography, time period, and counterfactual.
A practical implementation sequence is:
- Define the decision. State which policy lever may change and which outcome should respond.
- Select domains. Retain domain-level measures, then use composites only when their weighting is explicit and defensible.
- Pair data types. Combine validated survey instruments with administrative records and geographic information system layers.
- Validate the signal. Compare reported changes with observable land-market, service-access, health, housing, or environmental variables.
- Institutionalize review. Record data vintages, preserve question wording, disclose weights, and publish results by relevant tenure and geography.
Composite indices should function as decision aids, not rankings detached from action. A finance ministry can use scenario modeling software to test how alternative revenue structures might affect land values, services, household burdens, and subjective outcomes, but the model should expose assumptions rather than conceal them.
A minimum viable system needs a stable survey protocol, linked administrative data, a spatial reference layer, domain-level reporting, and a documented method for weighting or aggregation. It also needs named responsibility for data quality and a reporting cycle that lets officials distinguish genuine change from revisions in collection.
Case Studies and Documented Precedents
Claims about land-based fiscal policy should be tested against documented precedents, not presented as automatic success stories. The jurisdictions named in the evidence base, Denmark, Estonia, Singapore, Alaska, Canberra, Norway, and Allentown, offer different institutional arrangements and therefore shouldn't be treated as interchangeable models.
The available evidence here identifies these precedents as relevant examples of land-based fiscal reform, but it doesn't provide verified outcome statistics for each jurisdiction. That limitation matters. A rigorous analyst can describe the reform context and the measurement question without inventing a child-poverty result, housing-cost change, public-satisfaction movement, or spatial-inequality effect.
| Jurisdiction | Reform | Indicator tracked | Documented outcome |
|---|---|---|---|
| Denmark | Ground-rent compensation model | Not specified in the verified evidence | No quantified outcome provided |
| Estonia | Land-tax transition | Not specified in the verified evidence | No quantified outcome provided |
| Singapore | Lease-reserve fund allocations | Not specified in the verified evidence | No quantified outcome provided |
| Alaska | Permanent Fund dividends | Not specified in the verified evidence | No quantified outcome provided |
| Canberra | Land-rent system | Not specified in the verified evidence | No quantified outcome provided |
| Norway | Municipal land-value capture | Not specified in the verified evidence | No quantified outcome provided |
| Allentown | Neighborhood tax experiment | Not specified in the verified evidence | No quantified outcome provided |
What these precedents can and can't establish
Denmark and Estonia are useful for examining how land-based charges interact with existing tax systems. Singapore raises questions about lease administration, reserve management, and how public land arrangements shape fiscal capacity. Alaska is relevant to the distribution of resource rents through public dividends. Canberra provides a case for studying land-rent systems at the city level, while Norway and Allentown illustrate the importance of local institutional design.
None of those labels, by themselves, proves an improvement in quality of life. To establish an outcome, analysts would need a defined baseline, a consistent indicator, a comparison group or counterfactual, and disaggregated results. They'd also need to separate changes caused by the fiscal instrument from changes caused by employment, migration, interest rates, service reforms, or broader land-market conditions.
Four reporting failures recur in this type of analysis:
- Composite confusion: A higher index score gets presented as a policy outcome without showing which domains changed.
- Averaging bias: A citywide improvement hides deterioration among renters, leaseholders, low-income households, or peripheral neighborhoods.
- Fixed-lease mislabeling: A fixed-term arrangement gets called a land-use right, obscuring repricing risk and weakening fiscal analysis.
- Survey-question drift: Changes in wording or response scales make results appear to move when the instrument changed.
Minimum standards for credible comparison
A finance ministry should publish explicit weights, identify data vintages, run sensitivity tests, and report results by tenure and geography. Those practices make it possible to distinguish a real distributional effect from a technical artifact.
The most useful next step isn't to copy a named jurisdiction. It is to build an indicator disclosure template that states the policy question, unit of analysis, data source, collection date, domain definitions, weighting method, missing-data treatment, tenure categories, geographic breakdown, and interpretation limits. Analysts can then compare reforms without turning incomplete evidence into false precision.
Unitism® offers research, land valuation frameworks, distributional modeling, policy design, and implementation support for governments assessing land-based revenue reforms. Visit Unitism® to explore practical tools and guidance for connecting land value, public services, and quality of life measurement.