Define boom and bust cycle clearly, with causal drivers, housing examples, public-finance impacts, and land-value policies that can soften the next downturn.
September 3, 2026
Define Boom and Bust Cycle: A Plain-Language Guide
Define boom and bust cycle clearly, with causal drivers, housing examples, public-finance impacts, and land-value policies that can soften the next downturn.
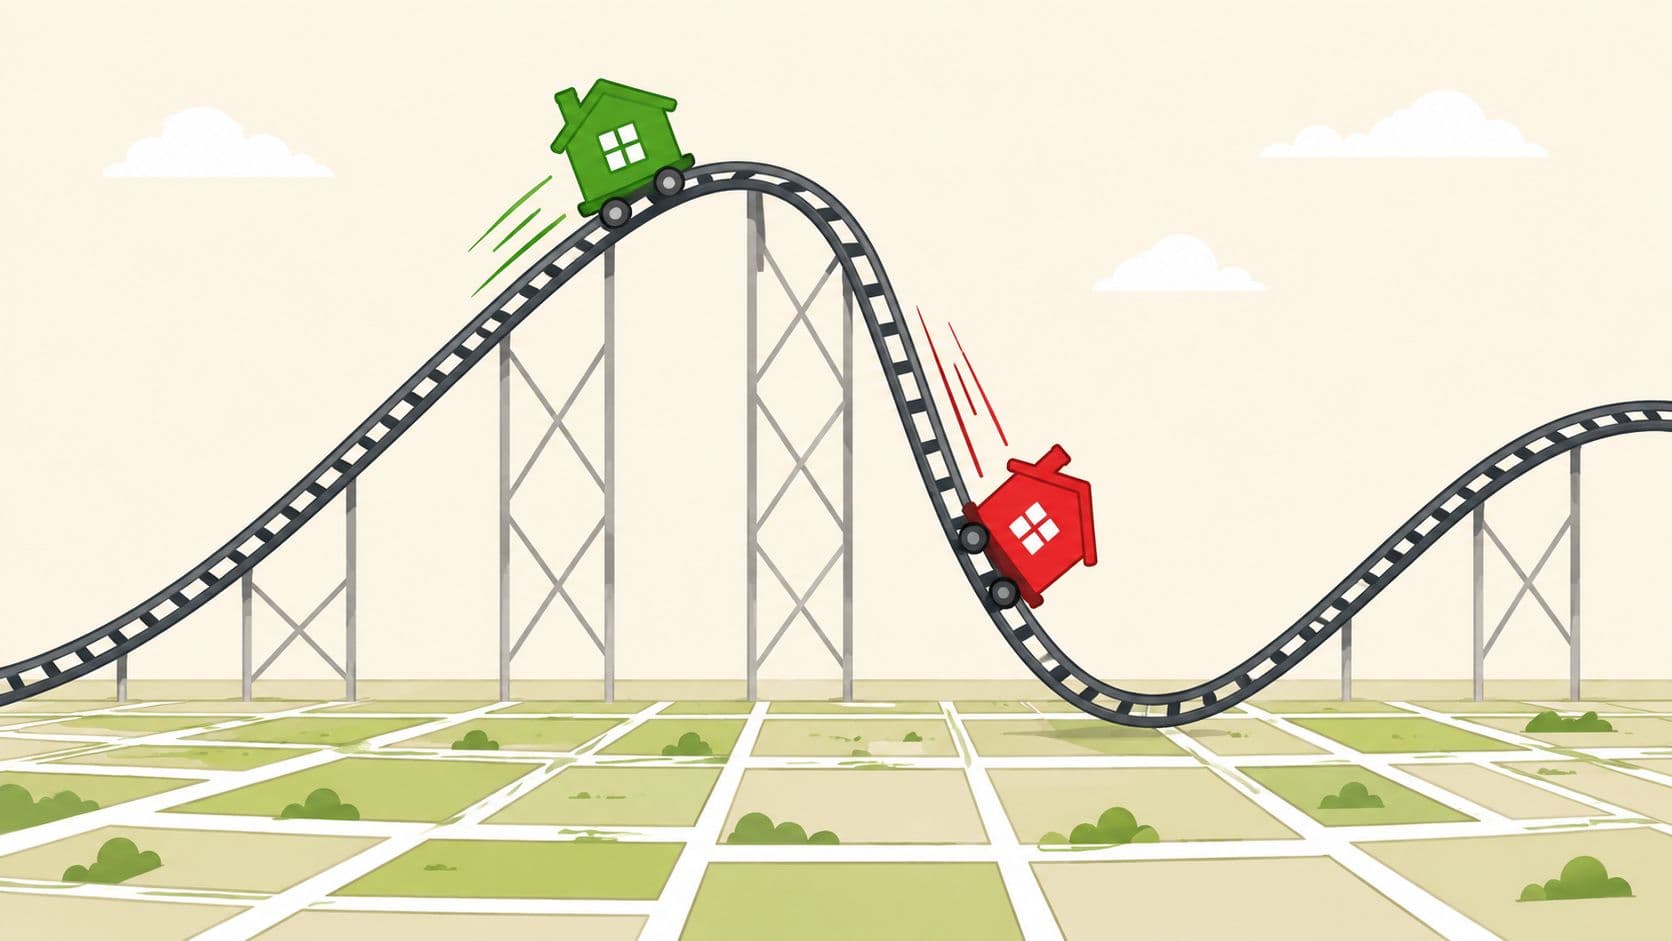
A boom and bust cycle is a recurring pattern of expansion followed by contraction, and the historical record includes full cycles averaging about 56 months, with expansions averaging 38.7 months and contractions 17.5 months between 1854 and 2009. In housing, the pattern can be dramatic: real prices in the U.S. Case-Shiller 10-city index rose 125% from the 1996 trough to the 2006 peak, then fell 38% during the bust.
On a Pacific coast street, “For Sale” signs crowd every block. Contractors fill the espresso lines, discussing additions and quick renovations, while a first-time buyer stares at a modest 1948 bungalow and asks why it now lists for four times its 2015 value. Nobody in line can see the exact turning point, but everyone can feel that confidence, credit, and land prices are leaning heavily in the same direction.
Table of Contents
- A Coastal Housing Peak and the Working Definition
- The Core Mechanism Behind Every Boom and Bust
- What Amplifies a Normal Expansion into a Full Bust
- Three Historical Examples That Make It Real
- How Busts Hit Public Finances and Housing Markets
- Land Leases, Fixed Terms, and True Land Use Rights
- Land Value Taxation as a Built-In Stabilizer
- Slowdown or Bust Frequently Asked Questions
A Coastal Housing Peak and the Working Definition
The bungalow buyer's question begins with a familiar scene. A modest coastal home becomes far more expensive, buyers stretch their budgets, and lenders treat rising collateral values as reassurance. Then the mood changes. Credit tightens, bids weaken, and the same price gains that encouraged borrowing begin to work in reverse.
A boom and bust cycle is a repeated economic rhythm. During the boom, prices rise, lenders extend credit more readily, households expect further gains, and businesses increase production. During the bust, prices fall, banks restrict lending, buyers retreat, construction slows, and weaker demand reduces output and employment. The National Bureau of Economic Research record covers 34 U.S. business cycles between 1854 and 2020 and shows that peak-to-trough downturns have ranged from 2 months to 65 months, so the cycle has no preset timetable, as documented in this NBER working paper.
The distinction between a normal business cycle and a housing-led financial cycle matters. Ordinary cycles can turn on inventories, interest rates, employment, and consumer demand. A land-and-credit financial cycle adds a balance-sheet feedback loop. Rising site values support larger mortgages, larger mortgages support higher bids, and higher bids persuade banks and owners that inflated collateral values represent lasting wealth.
Working definition: A boom and bust cycle is an expansion fed by rising prices, accessible credit, and confident expectations, followed by contraction when prices, lending, spending, and output turn downward.
Housing makes the mechanism easy to see. Land cannot be manufactured like ordinary goods. Builders can add structures, but desirable locations remain scarce, and construction takes time. The resulting delay lets prices and expectations run ahead of physical supply, helping explain why housing is unaffordable.
Public mood can provide clues about changing expectations. Tools such as sentiment analysis in trend detection add context, but sentiment alone cannot show whether a market faces a routine slowdown or a credit-driven bust.
The Core Mechanism Behind Every Boom and Bust
Think of the market as a seesaw. On one side sit cheap credit, rising land prices, and confident buyers. On the other sit household budgets, bank capital, and the ability of builders to deliver new homes. The boom begins when the first side gains weight, but the system becomes fragile when rising prices make borrowers and lenders believe the seesaw can keep tilting forever.
Four stages of the cycle
-
Origination starts with a change in opportunity, policy, technology, population, or credit conditions. Buyers notice that a location or asset may become more valuable, and lenders begin assessing borrowers and collateral more favorably.
-
Acceleration follows as rising prices validate earlier purchases. Banks expand lending, buyers borrow more to compete, and developers commit to projects that only make sense if expected land values continue rising.
-
Euphoria appears when recent gains become the main argument for future gains. Households stretch budgets, investors accept thinner margins, and vacant or underused sites can be held for appreciation rather than productive use.
-
Reversal begins when financing costs rise, incomes weaken, construction catches up, or buyers stop bidding. Falling collateral values reduce bank net worth, lenders pull back, and forced sales add supply just as demand is weakening.
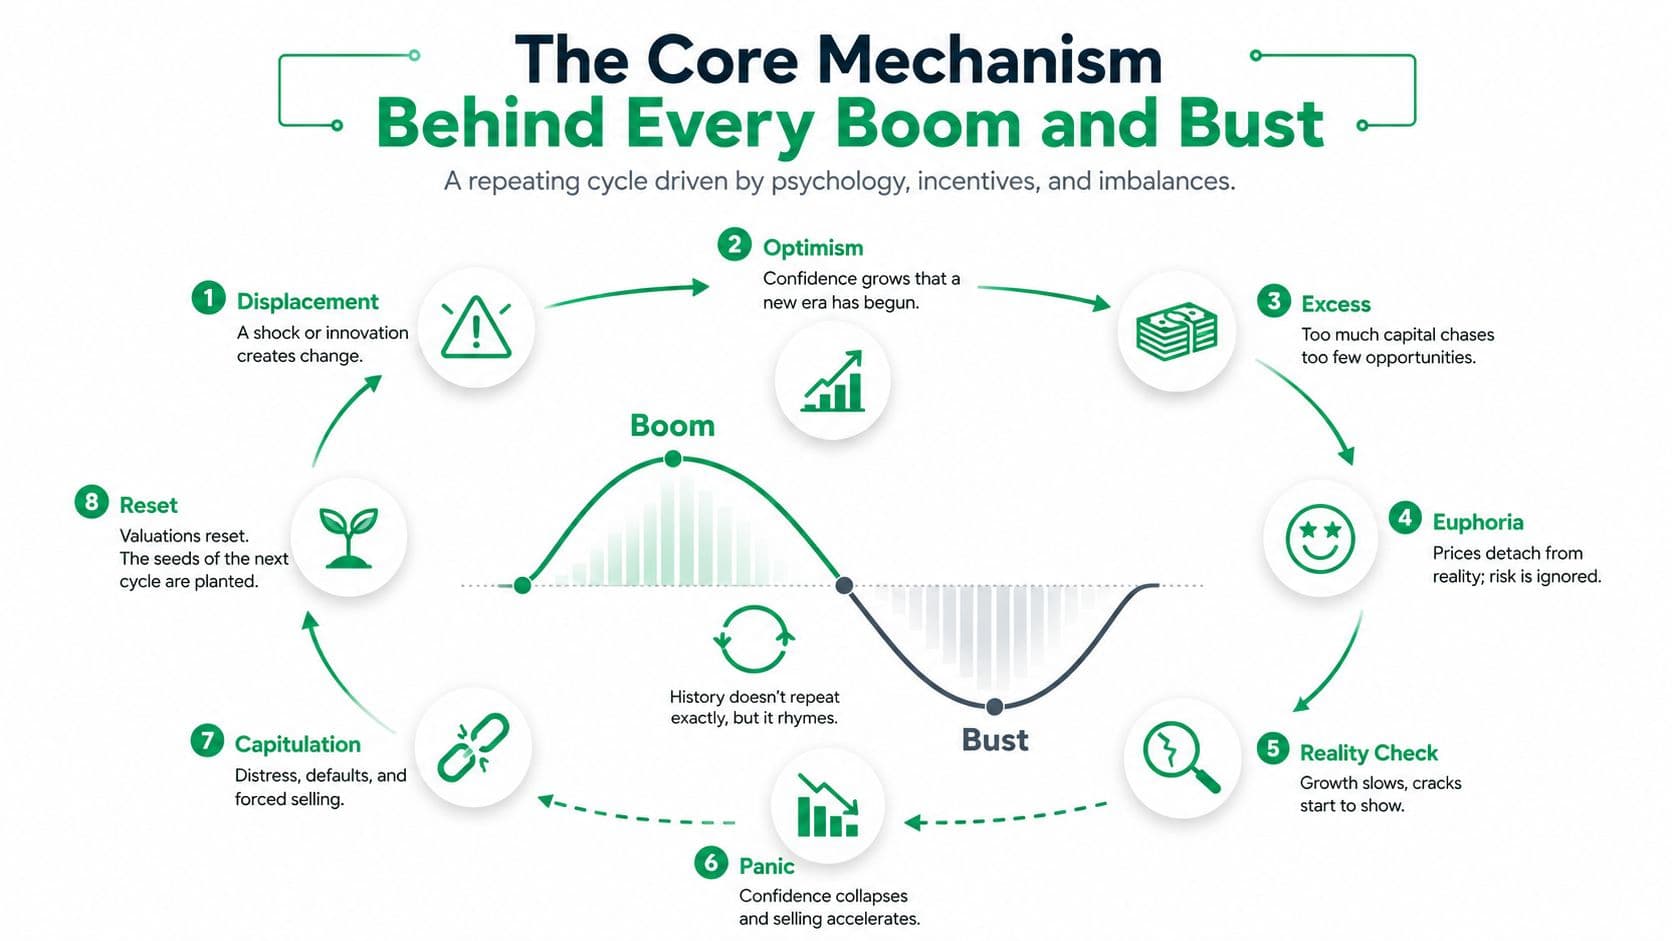
An ordinary business cycle is usually more like a thermostat responding to a room that has become too warm. Firms produce too much, inventories accumulate, interest rates or demand change, and businesses reduce output until conditions normalize. A land-and-credit cycle is different. It behaves like a thermostat with a delayed sensor, allowing the temperature to overshoot before the system reacts. Prices rise beyond what household incomes can support, then fall beyond what current rents or construction costs alone would imply.
The practical test is straightforward. If inventories, employment, and interest rates explain most of the movement, you're probably looking at an ordinary business cycle. If mortgage growth, land rents, bank credit creation, collateral values, and refinancing conditions reinforce one another, you're looking at a financial cycle rooted in land and credit. A grounding in land economics helps separate the site itself from the buildings and financial claims layered on top of it.
What Amplifies a Normal Expansion into a Full Bust
Several mechanisms work together to turn a routine expansion into a serious bust. Rising land prices alter lending decisions, construction plans, and the behavior of asset owners.
Banks pull back on lending when conditions shift
When land prices rise, banks often see stronger collateral and borrowers appear safer. That can support additional mortgage lending, creating more purchasing power for land. The BIS describes this process through credit expansion and contraction: easier bank funding can lower lending rates, increase borrowing, and raise asset demand. When that credit window closes, bank net worth contracts, lending rates rise, and the downturn becomes stronger. The BIS working paper on credit and boom-bust dynamics provides the technical foundation for this explanation.
The seesaw becomes unstable because the same collateral supports both sides of the transaction. A buyer pays more because the bank lends more, while the bank lends more because the asset appears more valuable. After prices fall, the feedback reverses. Banks protect capital by reducing new loans, borrowers lose refinancing options, and weaker demand pushes prices down further.
Housing supply reacts slowly
Housing construction has long lags. Planning rules, land assembly, permitting, skilled labor, materials, and infrastructure delay the arrival of new units. By the time builders finish projects approved during the boom, demand may have weakened. Wharton real-estate literature identifies long construction lags as one reason housing experiences sharp cycles, alongside the difficulty of short-selling the underlying asset and the limited availability of effective bubble hedges. These issues also appear in research on construction incentives.
Land doesn't clear like ordinary goods
A retailer can discount unsold products quickly. An owner of an empty lot usually cannot profit by selling the site short and may prefer to wait rather than publicly accept a lower price. Price discovery therefore slows. Owners hold land off the market, lenders postpone recognizing losses, and buyers receive fewer clear signals about the site's worth.
Lease design can affect this adjustment. A fixed-term lease may leave a site tied to an earlier rent while market conditions change. An indefinite lease with annual repricing can reflect changing land values sooner, reducing the gap between the site's current use and its market rent.
Together, these amplifiers explain why a housing bust can outlast a normal inventory correction. Credit expands demand, slow construction delays supply, and weak price discovery postpones the reset. A routine business cycle may cool through output and employment adjustments. A land-and-credit cycle can keep the seesaw moving after those ordinary pressures have begun to ease.
Three Historical Examples That Make It Real
A family buying near the U.S. housing peak might have experienced the cycle through ordinary decisions. The mortgage appeared affordable, nearby sales supported the price, and rising values made refinancing seem safe. After prices turned, the family faced more than a lower resale value. The lender had weaker collateral, while builders and local businesses lost customers.
The U.S. housing episode shows how far a land-and-credit cycle can spread. The Fiserv Case-Shiller 10-city index recorded a 125% real house-price increase from the 1996 trough to the 2006 peak, followed by a 38% decline during the bust, according to this NBER housing-cycle study. Mortgage losses, foreclosures, reduced construction, and damaged household balance sheets carried the reversal into the wider economy.
The longer NBER chronology adds a different comparison. The U.S. has experienced 34 business cycles between 1854 and 2020, while individual contractions differed greatly in duration and depth. Ordinary business cycles are expected to recur, but their effects depend on what supports the expansion. Production and demand can rise together gradually. Rapidly growing debt and collateral values can make the same expansion more fragile.
Hong Kong illustrates how lease design can influence land-value expectations. Before 1997, annual rent was fixed and not tied to increases in land value, so the rent collected was minimal. Public-land leasing can use several payment points, including an initial land premium, annual land rent, a premium for changing lease conditions, and a renewal premium, as described in this analysis of public-land leasing. A fixed arrangement can leave rent disconnected from current land value. An indefinite lease with annual repricing can adjust sooner, like a thermostat responding to changing conditions rather than waiting for a distant reset.
The point is not that one expiry date mechanically caused every price movement. Lease terms and public capture arrangements help determine how quickly land expectations are recognized and repriced.
Three boom-bust episodes side by side
| Episode | Trigger | Peak Indicator | Trough Indicator | Policy Lesson |
|---|---|---|---|---|
| U.S. housing cycle | Expanding mortgage credit and rising collateral values | 2006 housing peak | 38% real decline in the Case-Shiller 10-city index | Monitor credit expansion, not prices alone |
| U.S. business-cycle record | Varying economic and financial shocks | 34 cycles across the NBER chronology | Downturns ranging from 2 to 65 months | Duration and severity aren't fixed |
| Hong Kong public-land leasing | Fixed rent arrangements and lease-related repricing | Land-value gains outpaced annual rent capture | Renewal and expiration conditions affected expectations | Lease design changes how public value is collected |
How Busts Hit Public Finances and Housing Markets
A housing bust moves through public finances by several channels at once. Falling land and building values weaken collateral, banks reduce lending, households cut spending, and construction firms cancel or postpone projects. At the same time, governments collect less from property transfers and related transactions while facing greater pressure to support unemployed workers, distressed borrowers, and communities affected by foreclosures.
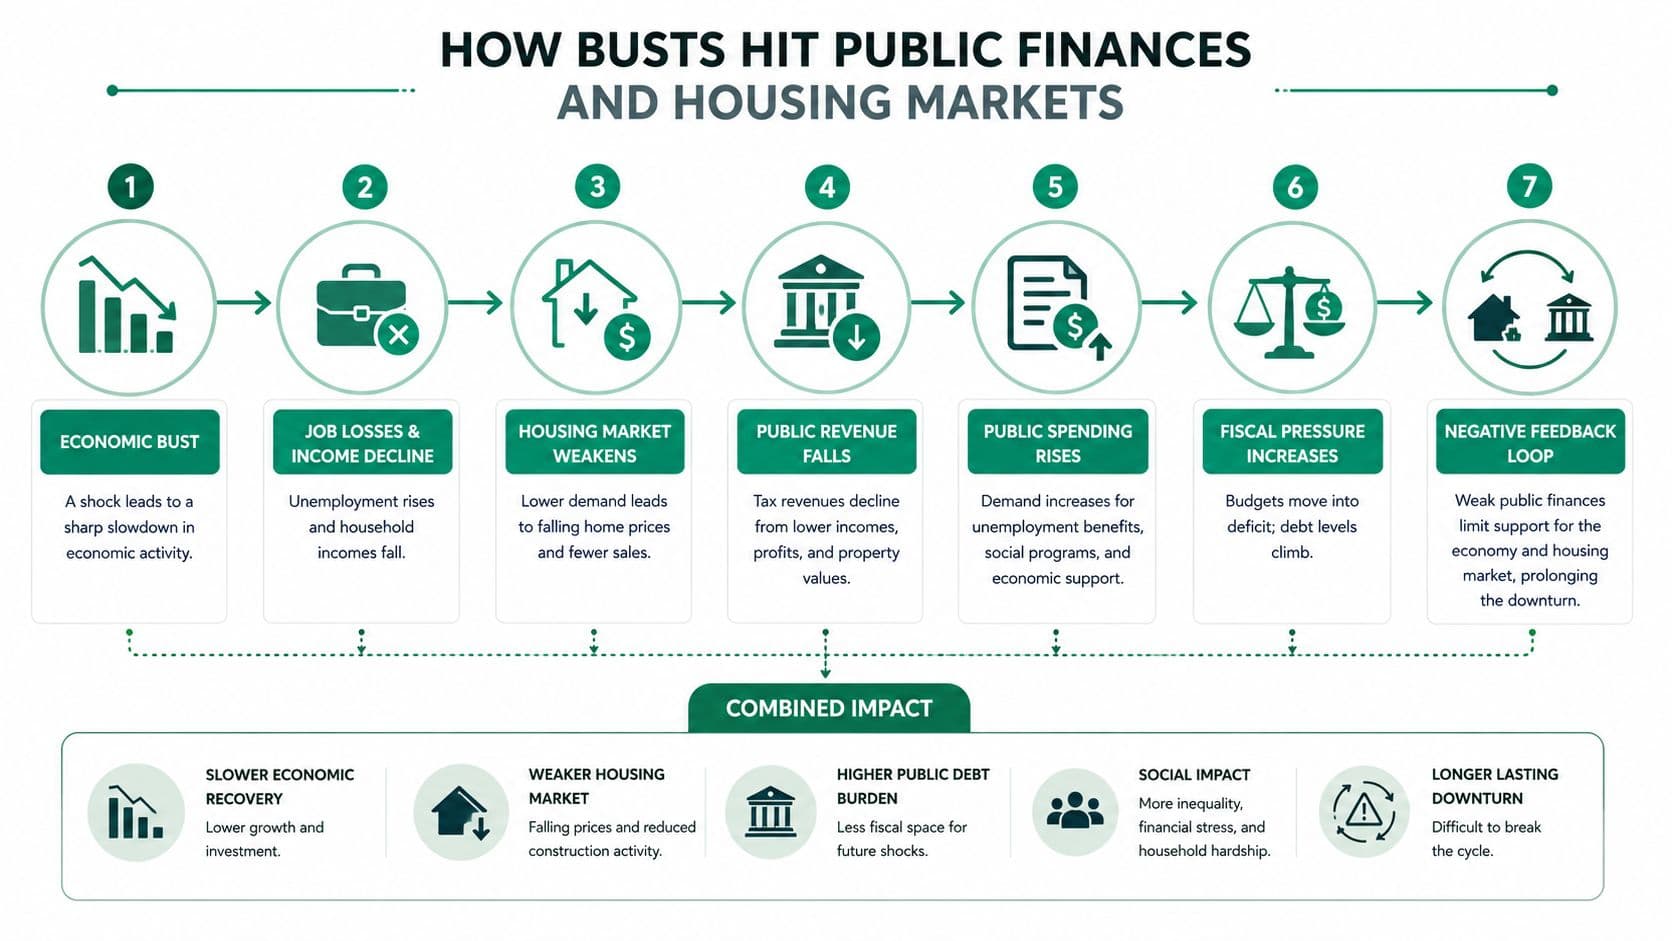
The sequence matters because local governments often depend on revenue that rises with property activity. A transaction-linked source performs well when homes change hands and prices climb, but it weakens precisely when households and lenders become cautious. British stamp duties can add to this sensitivity by tying public revenue to property transactions, while U.S. municipalities may face similar exposure through transfer-related income and development activity.
Falling land values don't stay on property statements. They affect bank lending, construction jobs, local revenue, and the public demand for support.
Housing downturns can also last longer than an ordinary recession because households and banks need time to repair balance sheets. The housing literature cited in the research brief finds that downturns are deeper and more prolonged after housing booms, especially when those booms coincide with rapid household credit growth. That combination leaves more debt to refinance and more collateral to revalue.
Readers examining current distress indicators should distinguish a foreclosure count from a full macroeconomic diagnosis. A practical starting point is this 2026 U.S. foreclosure rate guide, which can help frame foreclosure information without treating one indicator as proof of a national bust.
The central fiscal insight is simple: land values can move before tax receipts, employment, and construction do. Governments that rely heavily on land transactions or development-related income therefore experience an early and sharp revenue swing. A tax base tied to recurring site value behaves differently, because it doesn't depend entirely on whether a property changes hands.
Land Leases, Fixed Terms, and True Land Use Rights
People often use “land-use rights” as a loose synonym for any long lease. That creates confusion. A fixed-term lease has an expiration date, even if the term is long. An automatic-renewal lease remains subject to renewal mechanics and termination provisions. Guidance on fixed and automatic-renewal lease terms makes the contractual distinction clear.
For this discussion, land-use rights have two required features: they don't expire, and they're repriced annually. A fixed lease can have annual rent adjustments and still fail the first test. The Bureau of Land Management provides an example in which renewable-energy grants or leases can run for up to 50 years, while acreage rent and capacity fees are adjusted annually. Annual repricing doesn't turn that time-limited lease into an indefinite right, as shown in the BLM renewable-energy rule.
Comparing the structures
| Feature | Fixed-Term Lease | Renewable Fixed Lease | Indefinite Annually Repriced Land-Use Right |
|---|---|---|---|
| Horizon | Ends on a specified date | Ends unless renewed | Doesn't expire |
| Renewal | Not available after expiry | Required at the end of each term | Not required |
| Repricing | Fixed or contractually adjusted | Often resets at renewal | Occurs each year |
| Risk pattern | Risk is postponed toward expiry | Repricing can arrive as a renewal cliff | Changes are spread through annual repricing |
| Correct name | Lease | Renewable lease | Land-use right |
A renewable fixed lease provides certainty only until its term ends. At renewal, the accumulated gap between the fixed lease rate and the market can close in one major repricing. A non-renewable fixed lease becomes progressively harder to refinance and sell as expiry approaches, because buyers and lenders have fewer years over which to recover their investment. Fixed pricing doesn't eliminate risk. It postpones risk.
Indefinite annually repriced rights behave differently. Because the charge updates each year, buyers and sellers don't need to price a large expiry cliff into the asset. A lower-cost transfer can support productive businesses, while annual repricing keeps the site charge connected to current land value rather than allowing a private windfall to accumulate unnoticed.
Land-value reform discussions sometimes call a long ground lease a “land-use right.” That label is inaccurate unless the arrangement doesn't expire, requires no renewal, and is repriced every year. For a deeper look at the expiry problem, see this discussion of 99-year land leases.
Land Value Taxation as a Built-In Stabilizer
A land-value tax applies to the site, not to the building or other improvements. The Federal Highway Administration describes the approach as shifting the tax base away from improvements and toward unimproved land, with the assessment based on land value alone. That makes it different from a conventional property tax, which generally includes both the site and the structures on it.
The difference is easier to understand through a garden analogy. Suppose a tenant rents a garden site and builds a greenhouse, improves the soil, and grows a valuable harvest. The building effort and harvest are the tenant's productive contributions. A land-value tax targets the garden's location value, the economic rent created by access, infrastructure, and community activity, rather than taxing the greenhouse more heavily because the tenant improved it. The mechanism is outlined in this explanation of land-value taxation.
What changes during the cycle
A pure land-value tax places the charge on the site. A split-rate system also shifts more weight toward land and less toward improvements. During a boom, rising site values increase the public share of location rent without making new construction itself the object of a heavier tax. That can reduce the incentive to hold empty land purely for appreciation.
During a bust, assessed land values can fall with market conditions. Revenue won't become immune to economic weakness, but the public system can rely less on transaction taxes that disappear when sales freeze. The policy therefore addresses the feedback between land prices and credit rather than pretending it can abolish all business cycles.
The tradition reaches back to George and the Henry George School, while modern examples include Pennsylvania municipalities and other documented land-based approaches. The central policy question is incidence, meaning who pays, who benefits, and how the charge affects land prices, construction, and public services. A careful design needs valuation methods, transition rules, and transparent assessment rather than a slogan.
A land-value tax doesn't prevent every downturn. It can reduce the reward for speculative land holding and make public revenue less dependent on a rising volume of property transactions.
Slowdown or Bust Frequently Asked Questions
Is a GDP slowdown the same as a credit-led bust?
No. A GDP slowdown can reflect weaker inventories, demand, or interest-sensitive spending. A credit-led bust also involves falling collateral values, tighter refinancing, bank losses, and forced balance-sheet repair.
Why can one city soften while another remains expensive?
Land supply, job access, construction constraints, household debt, and local credit conditions differ by market. Housing cycles are uneven, not uniform across every city.
Do low interest rates prevent a bust?
No. Lower rates can support borrowing and asset demand, but they don't remove excessive debt, overvaluation, weak bank capital, or delayed construction.
How long does recovery take?
There isn't a fixed recovery period. The NBER record shows peak-to-trough downturns ranging from 2 months to 65 months, and housing-led contractions can be prolonged when debt expanded rapidly, according to the housing-boom macroeconomic evidence.
What separates a correction from a financial bust?
A correction may involve slower sales and modest price adjustments without widespread refinancing stress. A financial bust combines falling prices with credit contraction, distressed selling, bank weakness, and declining construction.
Do renters feel the cycle?
Yes, but differently. Renters may face weaker employment and changing rents, while owners and landlords carry the direct exposure to mortgage payments, collateral values, and refinancing conditions.
Unitism® offers land valuation assessments, land-value capture policy design, fiscal and distributional modeling, implementation support, and plain-language education for governments and communities examining boom-bust risk. Visit Unitism® to explore how separating land, labor, and capital can support a more stable approach to housing and public finance.