Explore key sensitivity analysis techniques for fiscal and valuation models, and see how each method helps you assess risk and make informed decisions.
August 20, 2026
Sensitivity Analysis Techniques for Fiscal Models
Explore key sensitivity analysis techniques for fiscal and valuation models, and see how each method helps you assess risk and make informed decisions.

A finance team can spend days building a fiscal model, then present a neat sensitivity table that gives equal visual weight to every assumption. The table may flex collection losses, discount rates, development activity, and land rent, but the assumption that drives the result most strongly sits in a footnote. Ministers see a range. They don't see which contractual feature created it.
That distinction matters in land policy. A fixed-price lease, a renewable lease, and an annually repriced land-use right don't expose the public budget to the same risks. The instrument determines which variables can move, which are locked by contract, and which should be treated as policy choices rather than market uncertainty. Good sensitivity analysis techniques begin there, before anyone chooses a tornado chart or a Monte Carlo engine.
Table of Contents
- Why Sensitivity Analysis Matters for Land-Value Policy
- Core Sensitivity Analysis Techniques and When to Use Them
- Running One-Way, Multi-Way, and Tornado Analyses
- Scenario Analysis and Monte Carlo for Fiscal Models
- Matching the Method to the Instrument Lease Versus Land-Use Right
- Interpreting Results and Communicating Uncertainty
- Troubleshooting Checklist and Best Practices
Why Sensitivity Analysis Matters for Land-Value Policy
Consider a finance ministry preparing a revenue forecast for a land-based charge. Officials have estimated site values, applied a statutory rate, projected collection efficiency, and discounted future receipts. The briefing includes a familiar one-way table. Land values move up and down, arrears change, and administrative costs vary. The land-rent assumption appears as one line among many, even though the underlying instrument may reprice annually or remain fixed until a lease event.
That presentation can survive a technical meeting while failing a policy review. If the government is assessing a land-value tax, the tax base is unimproved land, not buildings or improvements. The Federal Highway Administration's definition of land-value tax describes an annual charge on the rental value of land, which makes valuation, revaluation, compliance, and appeals central modeling questions. A lease model has a different architecture because rent may be contractually fixed, while a land-use-right system can reset the land-use price each year.
A practical model should answer three questions:
- Which input changes the result most?
- Is that input uncertain, or is it a deliberate policy lever?
- Would the ranking remain stable if the model were rerun?
The third question is regularly neglected. A 2024 review found that proper convergence analysis remains “somewhat deficient in practice” and called for better comparisons of methods and stopping rules in global sensitivity analysis (review of convergence diagnostics). A ranking that changes materially as simulations accumulate shouldn't be presented as a settled policy priority.
Typical Fiscal Sensitivity Disclosure Gaps
| Variable | Usually Reported | Often Omitted |
|---|---|---|
| Site value | Base, upside, downside cases | Valuation error and parcel-level dispersion |
| Statutory rate | Alternative rates | Political feasibility and transition constraints |
| Collection efficiency | Aggregate assumption | Differences across property types and administrative areas |
| Discount rate | A selected rate | The effect of timing and exit assumptions |
| Land rent | A central forecast | Whether rent is fixed, periodically reset, or annually repriced |
| Lease terms | Contract duration | Renewal probability and repricing mechanics |
| Compliance | A single loss factor | Behavioral responses and appeal outcomes |
For a starting point on the mechanics behind site valuation, the guide to calculating land value is useful, but the model still needs an instrument-specific uncertainty design. The rest of this article focuses on that design, including where simple methods work, where they mislead, and how to communicate results without disguising judgment as precision.
Core Sensitivity Analysis Techniques and When to Use Them
Sensitivity analysis asks how an output responds when model inputs change. In a fiscal model, the output might be annual revenue, present value, a housing-cost measure, or the probability of breaching a fiscal covenant. The method should match the question. A one-way test is useful for isolating a driver, but it can't explain interactions or produce a probability distribution.
Modern reviews commonly group sensitivity analysis into three broad families, screening methods, measures of importance, and deep-exploration methods (history and classification of sensitivity analysis).
Screening methods
Screening methods identify which inputs deserve further attention when the model contains many candidates. Morris-style elementary effects, regional screening, and structured one-at-a-time tests can reduce a large input list to a manageable set. They're efficient when a ministry needs to distinguish material drivers from variables that barely affect the result.
Use screening early, especially for a land-value tax model with many valuation, administrative, behavioral, and macroeconomic assumptions. Don't spend computational effort estimating precise importance measures for inputs that screening shows are immaterial.
Measures of importance
Importance measures quantify how much each input contributes to output variation. Tornado analysis ranks inputs according to their effect under selected low and high values. Correlation-based measures can work for approximately monotonic relationships. Variance-based methods, including Sobol indices, apportion output uncertainty to input uncertainty and can reveal interaction effects.
This family suits fiscal review when decision-makers need a ranked explanation of revenue exposure. It also supports valuation work, but only when the input ranges and dependence assumptions are defensible. The literature identifies variance-based methods as recommended practice among many practitioners, while also noting that published applications have often remained local or one-factor-at-a-time (applied sensitivity analysis review).
Deep exploration
Deep-exploration methods examine nonlinearities, thresholds, dependence, and alternative model structures. Monte Carlo simulation, scenario analysis, surrogate models, derivative-based measures, density-based methods, and feature-additive approaches belong here. These methods are appropriate when the policy question concerns tail risk, interactions, or a system with correlated inputs.
Teams building this kind of workflow may benefit from a broader treatment of advanced analytics and predictive modeling, particularly when the fiscal model must connect valuation, behavior, and multiple policy pathways.
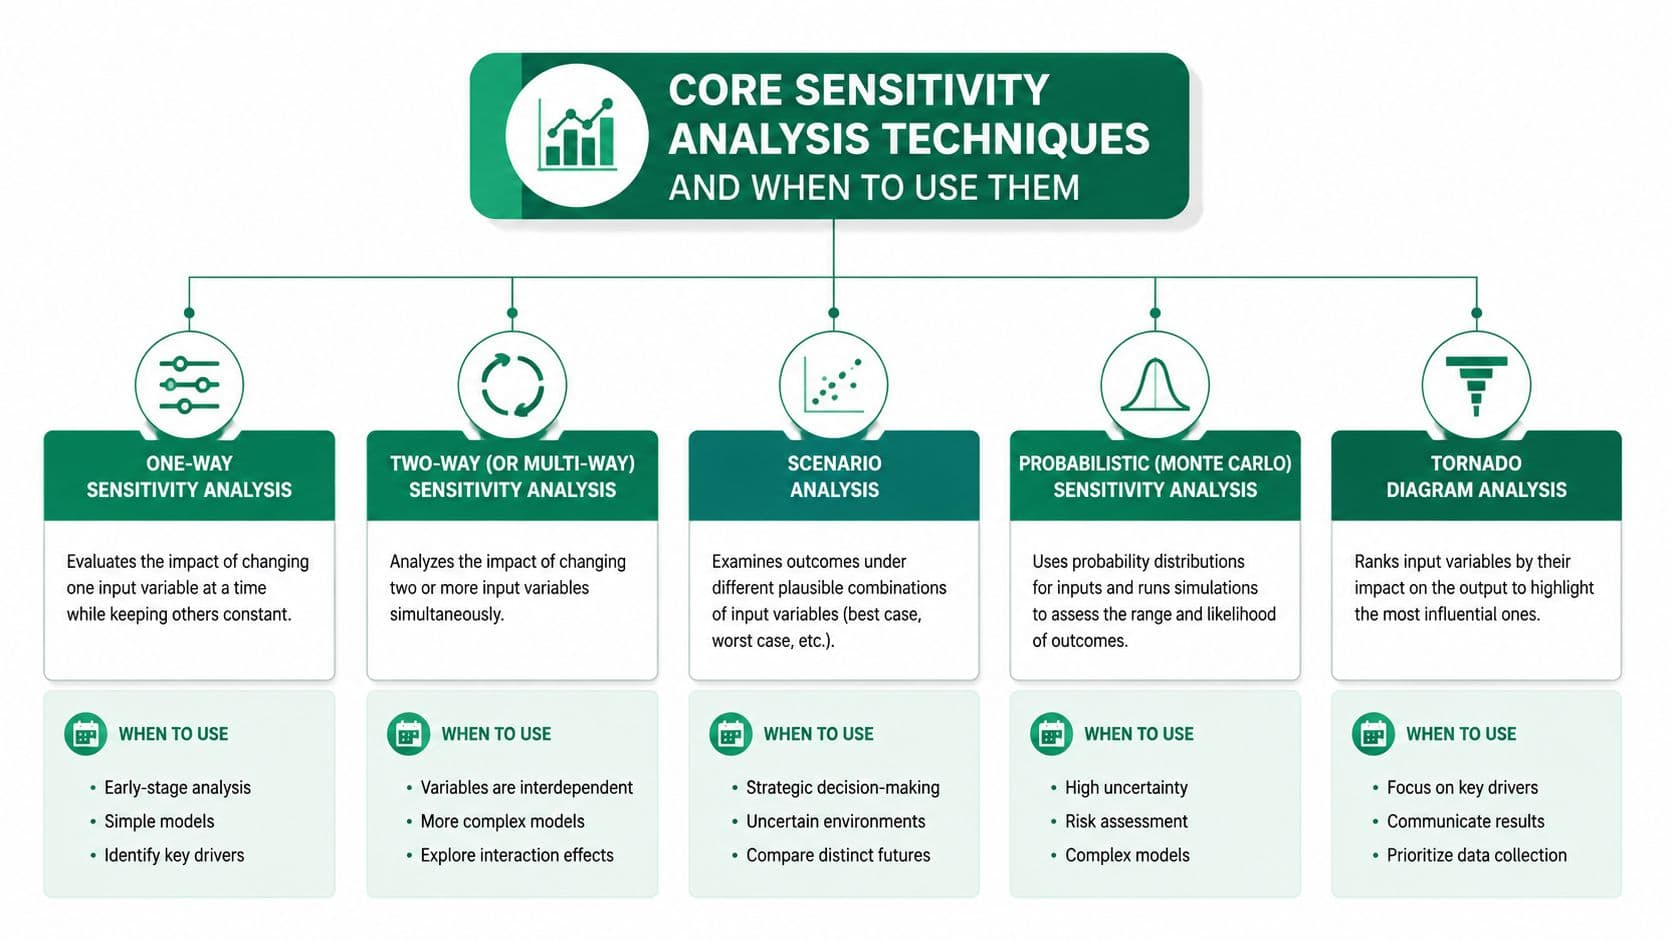
A sensible sequence is to screen first, estimate importance second, and explore in detail only where the decision warrants it. For revenue assumptions and forecast structure, a well-built revenue forecasting model can provide the base architecture, but it shouldn't determine the sensitivity method by itself. The land instrument and the decision threshold should.
Running One-Way, Multi-Way, and Tornado Analyses
Start with a transparent land-rent revenue equation:
Revenue = assessed site value × statutory rate × collection efficiency
Add lease-specific terms only where the contract requires them. For a fixed-price lease, the rent may be a contractual constant, while discounting and exit timing remain uncertain. For an annually repriced land-use right, the rent path, valuation frequency, compliance, and appeals may all be live inputs.
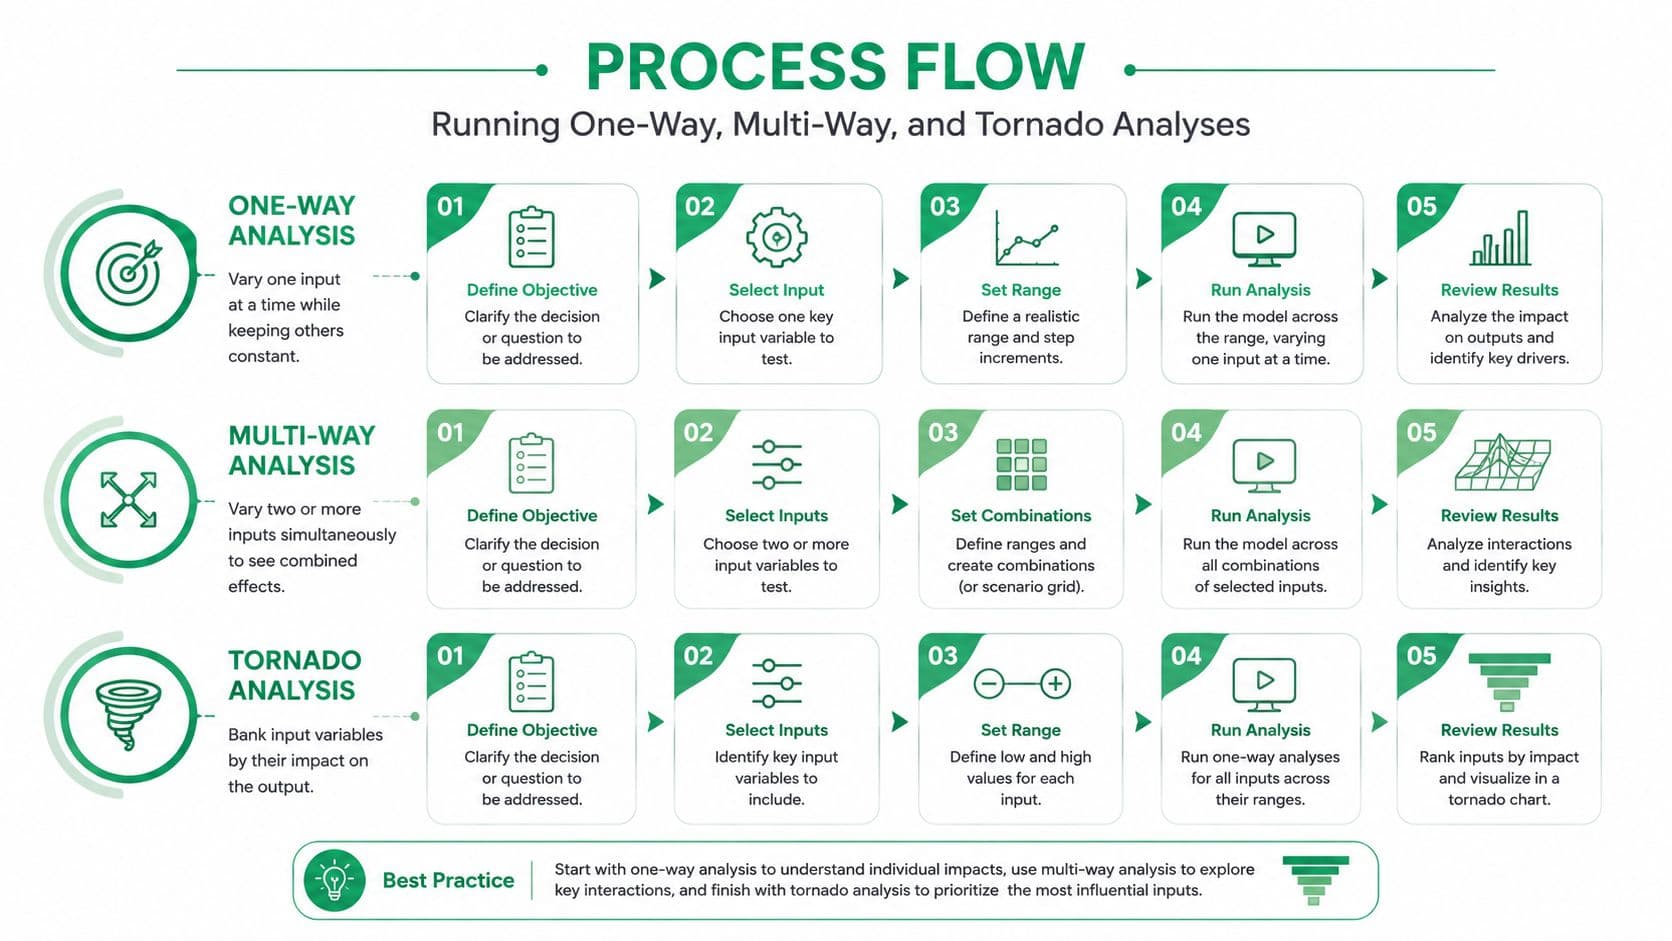
One-way analysis
Change one input while holding the others constant. Use a documented low and high value, not an arbitrary stretch designed to make the chart dramatic. A one-way run might flex the statutory rate, collection efficiency, annual land-rent growth, discount rate, or valuation error separately.
The result answers a narrow question: what happens if this one assumption changes while everything else stays unchanged? That makes it easy to explain, but the method can be unrealistic when variables move together. Rent growth may influence arrears, and a higher assessed value may trigger more appeals. One-way analysis won't capture those links.
Multi-way analysis
Change two or more inputs together to test a coherent policy or market condition. For example, combine stronger land revaluation with higher compliance in an administrative-improvement case, then combine weaker revaluation with wider collection losses in a stress case. The combinations should describe a plausible institutional story, not merely stack every favorable or unfavorable value.
Use a grid when the audience needs to see interaction directly. A two-dimensional table can show revenue across alternative rates and collection efficiencies, or across land-rent growth and discount rates. For larger models, use structured scenario combinations and preserve the input file so reviewers can reproduce each cell.
Tornado analysis
A tornado chart ranks the output swing produced by each input. It's excellent for committee meetings because it shows where attention belongs. It isn't a probability distribution, and the bar length doesn't mean that an outcome is likely.
Practical rule: Use a tornado chart to prioritize investigation, not to imply odds.
Before presenting the chart, label variables in policy language. “Annual site-rent reset” is more useful to a minister than “rent_growth_parameter.” Compare tornado ranks with a global measure when interactions matter. A ranking that changes sharply between the two is a finding, not a nuisance.
For broader context on structured fiscal impact analysis, connect the sensitivity output to distributional effects, transition costs, and administrative capacity rather than reporting revenue in isolation.
Scenario Analysis and Monte Carlo for Fiscal Models
Use the same land-value-tax base model for both methods. Define a static land parcel, its unit land value, the statutory rate, and the discount rate. Add collection efficiency and the revaluation path if the policy updates the assessed land value over time.
Scenario analysis then creates a small set of internally consistent stories:
- Baseline: Current valuation, expected collection performance, and the central discount-rate assumption.
- High-rent and revaluation case: Stronger land-rent growth and more frequent upward reassessment, with assumptions kept consistent with the chosen policy design.
- Stress case: Wider collection losses, weaker compliance, and a less favorable revaluation path.
Scenarios are useful because officials can challenge the story directly. They can ask whether the stress case is credible, whether the high-rent case is politically acceptable, and which administrative action would move the model from one path to another. The weakness is selection. A small set of scenarios can hide outcomes that fall between the labels or combinations that no one thought to include.
Monte Carlo simulation treats inputs as distributions. Assign a lognormal distribution to the revaluation path when the model requires a positive, multiplicative process. Use a Beta distribution for collection efficiency when the variable is bounded between zero and one. Use a PERT or triangular distribution for the discount rate when judgment provides a minimum, most likely, and maximum rather than a long historical series.
Rent growth and arrears shouldn't automatically be sampled independently. If faster rent growth produces more arrears, encode that relationship through a rank correlation or a suitable copula. Otherwise, the model may combine high rent growth with unusually low arrears too often and overstate revenue resilience.
For a serious fiscal review, run 5,000 to 10,000 simulations, using a fixed random seed and recording the software, version, input distributions, and correlation assumptions. Report percentile bands and the probability that revenue falls below the fiscal covenant. Those run counts are a modeling specification, not evidence that the output is accurate. Convergence still needs testing.
| Dimension | Scenario Analysis | Monte Carlo |
|---|---|---|
| Main question | What happens under defined stories? | How often do modeled outcomes occur under the assumed distributions? |
| Strength | Clear policy narrative | Rich output distribution and tail analysis |
| Main weakness | Omits unselected combinations | Sensitive to distribution and dependence assumptions |
| Best use | Ministerial choices and stress tests | Covenant risk, reserves, and uncertainty bands |
| Review requirement | Defensible scenario logic | Convergence, seed discipline, and distribution validation |
Scenario analysis exposes political and institutional choices. Monte Carlo reveals the range and frequency of combinations that a short scenario set may miss. Neither method can rescue a poorly specified land base.
For teams evaluating software support, scenario modeling software should be judged by auditability, input governance, and reproducibility, not by the number of simulations a platform can run.
Matching the Method to the Instrument Lease Versus Land-Use Right
The instrument sets the uncertainty structure. Treating every rent variable as flexible can produce a polished chart that tests contractual facts instead of policy risk. Start by identifying which terms are fixed, which can change at renewal, and which are repriced during the holding period.
Fixed-price leases
A non-renewable fixed-term lease has a defined end date and contractually fixed rent. A renewable lease fixes rent during its current term, but that certainty ends at renewal. If the lease rate falls behind market value, the gap may close through a sharp repricing when the term expires. As expiry approaches, non-renewable leases can also become harder to refinance or sell.
For a fixed-price lease, prioritize one-way analysis, tornado analysis, and scenario analysis for discount rates, exit timing, refinancing conditions, vacancy, and residual value. Contractual rent should not dominate the chart because the instrument locks it for the term. Varying it as though it were a free market input diverts attention and can misstate the risks that decision-makers face.
Renewable leases
A renewable lease creates a discrete renewal and valuation event. New Zealand's Land Act 1948 defines a renewable lease as a 33-year lease with a perpetual right of renewal for another 33 years. During the first term, yearly rent is set at 4.5% of the land's rental value for the first 11 years, with later periods reset under statutory valuation rules (New Zealand Land Act).
The relevant uncertainties are renewal probability, renewal timing, revaluation magnitude, and the move from one rent-setting period to the next. Use multi-way analysis to vary renewal and revaluation together, Monte Carlo to represent uncertain timing, and tornado analysis to show which contractual event drives present value. A global index can add perspective, but only after the lease mechanics are represented correctly. Otherwise, the ranking may reflect an incorrectly modeled contract rather than a meaningful policy sensitivity.
Annually repriced land-use rights
Land-use rights resemble leases because the user holds a right to occupy or use land, but they are indefinite and repriced annually. See a guide to land-use rights for the underlying instrument. The annual reset makes valuation, user behavior, and public-sector revenue more responsive to changing land conditions than under a fixed-term lease.
Sweden provides an example of public land leasing in which municipalities retain ownership while charging for the right to use a site (public land leasing in Sweden). The distinction affects model design. A land lease transfers a time-bounded contractual right at a fixed price, while a land-use-right system keeps title with the public owner and can reset the land-use charge.
Use Sobol-style global analysis, dependent-input methods, and Monte Carlo for annually repriced rights. Vary rent-setting rules, land-value elasticity, compliance, appeals, and development response. Do not screen a rent variable with tornado or Sobol analysis if the instrument fixes that variable during the modeled period.
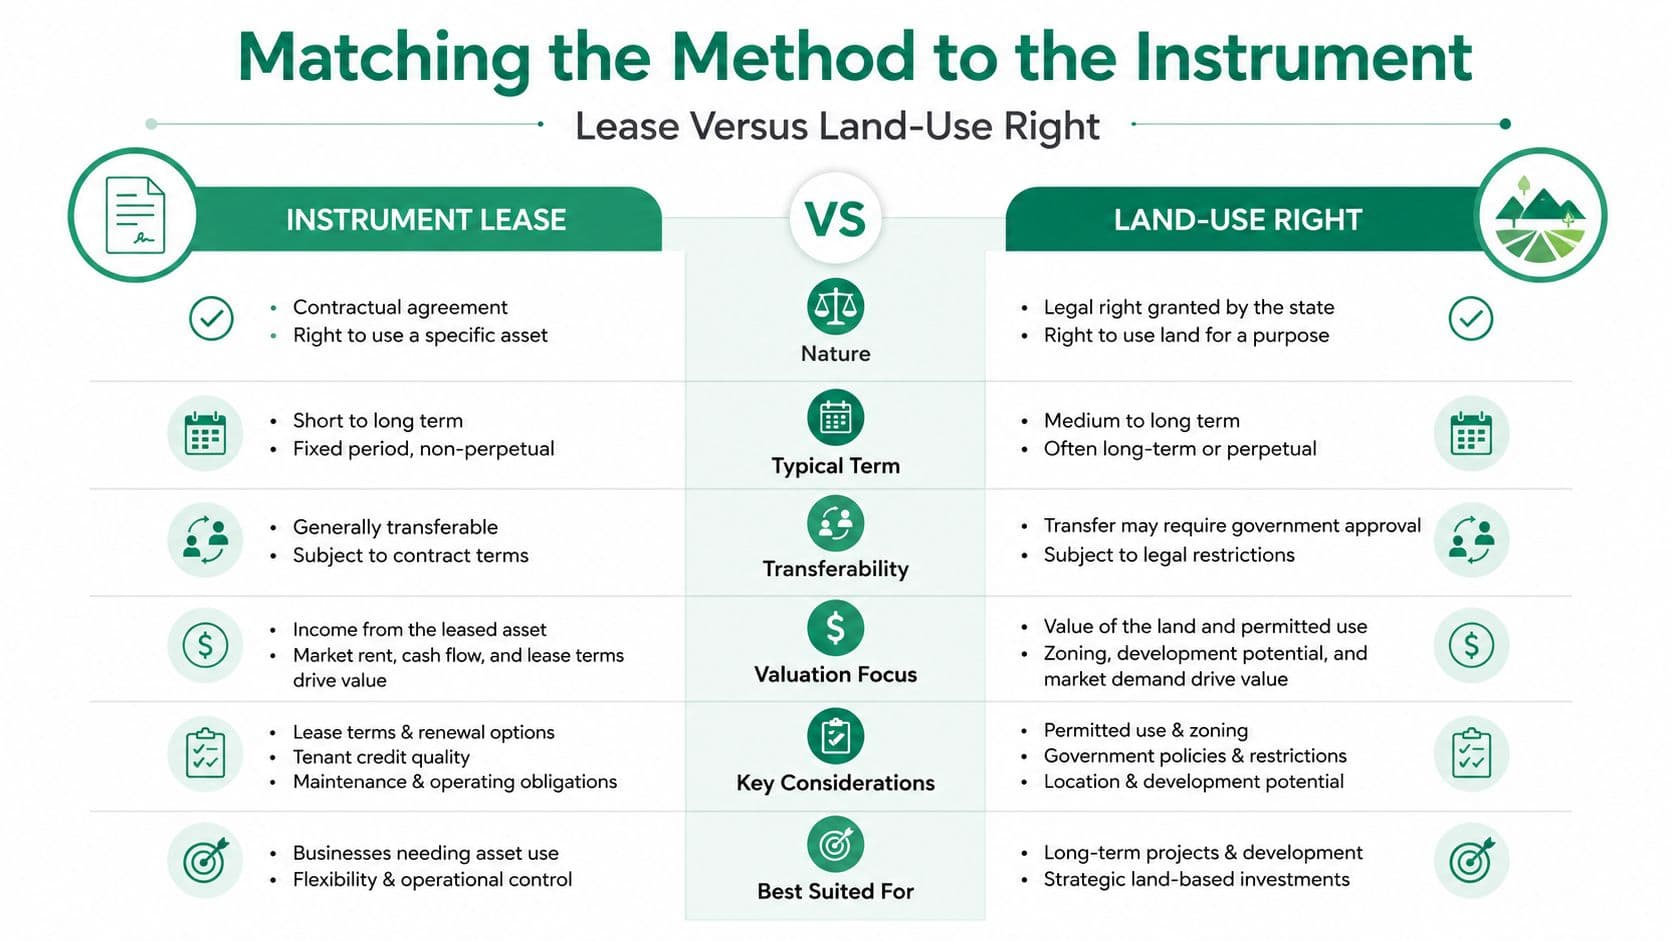
Decision rubric: If rent is locked until expiry, analyze timing and repricing risk. If rent resets at renewal, model the renewal event. If rent resets annually, analyze valuation, elasticity, compliance, and political tolerance.
A 50-year Hong Kong extension mechanism shows why annual repricing requires separate treatment. Eligible leases without renewal rights may be extended for 50 years without an additional premium, while the government charges annual rent equal to 3% of rateable value, adjusted yearly as rateable value changes (Hong Kong Legislative Council paper). The absence of a one-time premium does not make the charge fixed. Annual revaluation remains the main sensitivity driver.
Interpreting Results and Communicating Uncertainty
A sensitivity run is only useful if decision-makers understand what the output supports. Start with convergence diagnostics for Monte Carlo. Plot the running mean, monitor the standard error, and inspect selected percentiles as the sample grows. Stop when the decision-relevant statistics are stable under a documented rule, not merely because the model has completed a convenient batch.
A stable mean can still conceal a fat lower tail. If the average revenue settles while covenant breaches remain sensitive to additional draws, the model isn't ready for a confident fiscal recommendation. The convergence question is especially important for Sobol-style indices, where unstable rankings can create false priorities.
Dependent inputs need deliberate treatment
Land-rent growth and discount rates are often modeled as independent because the software makes independence easy. That can be wrong. A policy that increases assessed rent may also change arrears, appeals, political resistance, or the discount rate applied by investors. Classical global sensitivity analysis has important limitations when inputs are dependent, non-normal, or constrained by policy design (recent work on sensitivity analysis beyond independence assumptions).
Use rank correlation when the relationship is understood but its full joint distribution isn't. Use copulas when tail dependence and joint behavior matter enough to justify the added modeling complexity. Show a scatter matrix, inspect the simulated relationship, and explain what the correlation means in policy terms.
Translate output into decisions
Ministers rarely need a list of statistical diagnostics. They need a range, a trigger, and an explanation of what government can do about the driver.
- Use fan charts: Display percentile bands over time instead of a single revenue line.
- Name policy levers: Replace technical variable names with labels such as “annual land-rent reset” or “appeal resolution rate.”
- Separate uncertainty types: Distinguish uncertainty about future land values from uncertainty created by a proposed rate or compliance rule.
- State the boundary: Explain that the interval reflects the modeled assumptions and isn't a guarantee.
- Flag political exposure: Identify inputs whose sensitivity exceeds the institution's tolerance for rent volatility or revenue instability.
A credible uncertainty statement is specific about what was modeled, what wasn't modeled, and which decision would change if the range widened.
Troubleshooting Checklist and Best Practices
Run this checklist before a fiscal or valuation committee meeting. It catches the errors that polished charts tend to hide.
Pre-model setup
- Classify the instrument: Verify whether the asset uses a fixed-term lease, renewable lease, or annually repriced land-use right.
- Lock constants: Remove contractual rent, expiry dates, renewal clauses, and statutory mechanics from the flexible-input list when the contract fixes them.
- Document ranges: Record the source, rationale, and policy owner for every input range.
- Define the output: Decide whether the committee needs revenue, present value, distributional impact, or covenant risk.
Model execution
- Cross-check rankings: Compare tornado results with Sobol indices or another global measure where interactions matter.
- Test convergence: For multi-chain simulation diagnostics, confirm the Gelman-Rubin statistic is below 1.1 before relying on the sampled output.
- Validate dependence: Review a scatter matrix for land-rent growth, arrears, discount rates, and other linked inputs.
- Reconcile totals: Check that parcel-level results aggregate to the fiscal model's reported total.
Output interpretation
- Separate uncertainty: Keep base-case uncertainty distinct from uncertainty caused by a policy choice.
- Report intervals: Use confidence or credible intervals where the method supports them, rather than presenting only point estimates.
- Flag material swings: Highlight any input whose modeled swing exceeds 20% of the output range. Treat this as a review threshold, not a probability statement.
- Check stability: Re-run the ranking with additional simulations and inspect whether the decision-relevant ordering changes.
Stakeholder communication
- Attach a summary: Provide a one-page uncertainty brief with the range, key drivers, exclusions, and decision triggers.
- Identify judgment: Mark assumptions based primarily on expert judgment or political choice.
- Explain tornado bars: Tell readers that bar lengths show modeled output sensitivity, not probability distributions.
- Preserve the audit trail: Archive input distributions, seeds, correlations, code, and model versions alongside the final charts.
Rerun the sensitivity set whenever the instrument design changes. Archive the input distributions with the model so future reviewers can reproduce the result and see which assumptions changed.
Unitism® helps governments and policy teams connect land valuation, land-based revenue design, fiscal impact modeling, and implementation planning. Visit Unitism® to explore practical resources and advisory support for building auditable land-value policy models.