A definitive guide to fiscal impact analysis for policymakers. Learn key methodologies, modeling workflows, and how to apply FIA to land value capture.
June 30, 2026 — last updated July 1, 2026
Fiscal Impact Analysis: A Guide for Policy Makers
A definitive guide to fiscal impact analysis for policymakers. Learn key methodologies, modeling workflows, and how to apply FIA to land value capture.
A council agenda lands on your desk late in the afternoon. One item looks familiar: a proposed development, a tax incentive request, or a zoning change tied to promises of growth. The public narrative is easy to predict. Supporters talk about jobs, investment, and momentum. Opponents warn about traffic, school crowding, utility strain, and unfair taxpayer exposure.
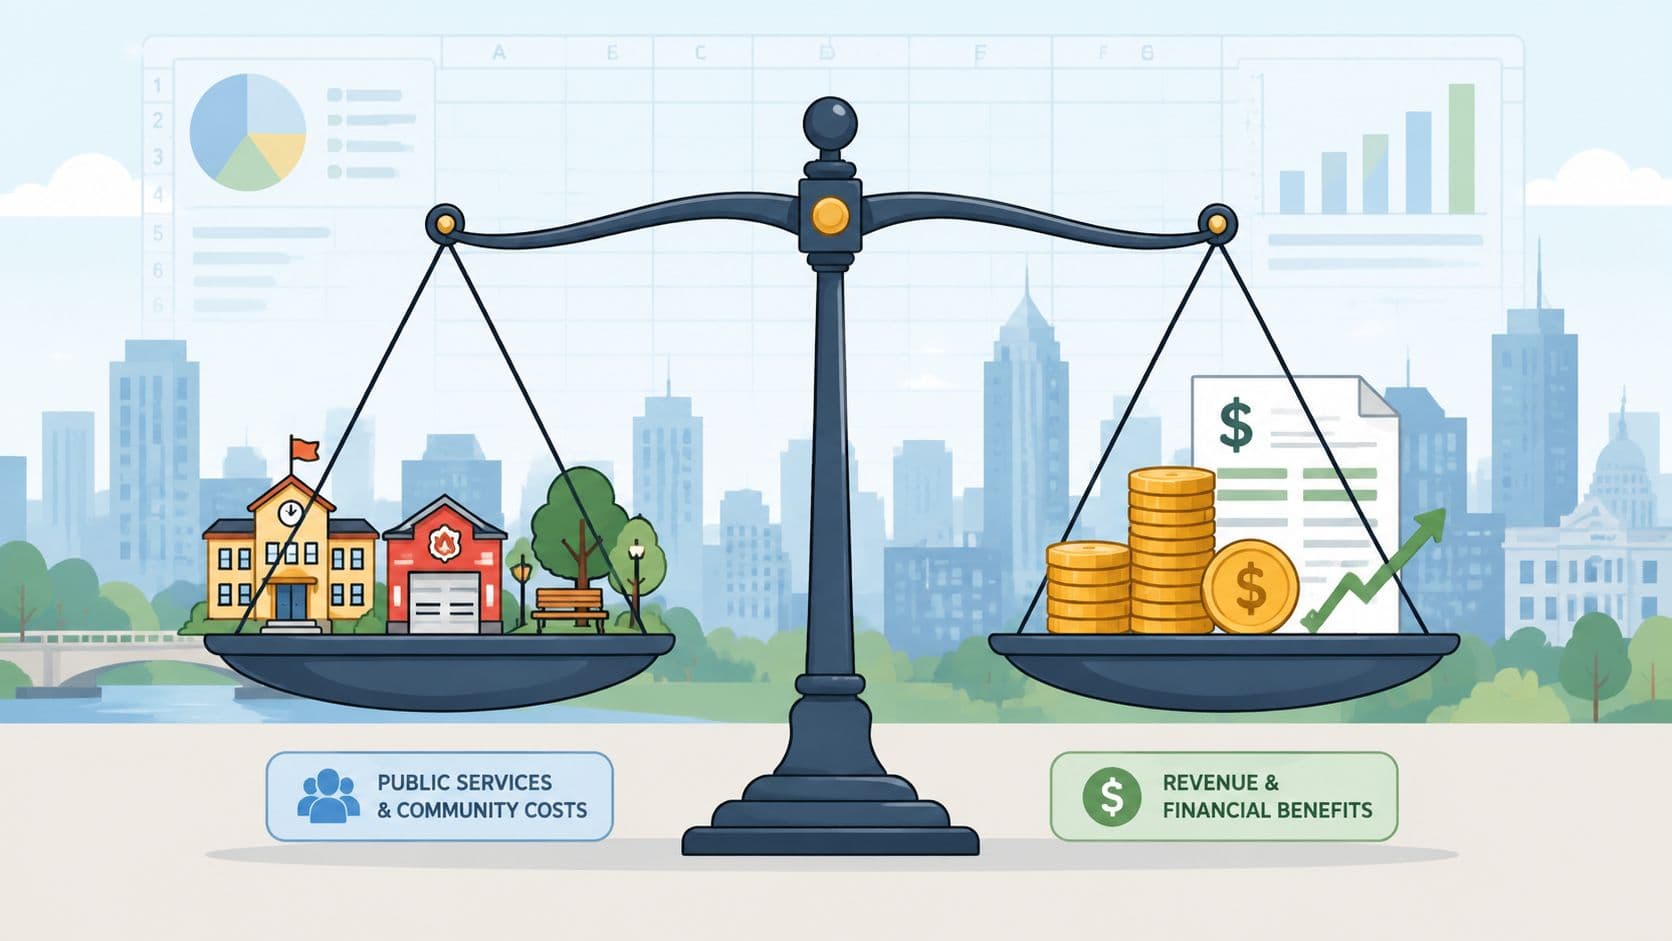
The harder question usually gets less airtime. Will the project improve the public balance sheet, or weaken it? That's where fiscal impact analysis earns its place. It doesn't ask whether development sounds attractive. It asks whether a jurisdiction can afford the public obligations that follow from it.
For policy makers, that distinction matters more than ever. Local governments are being asked to support housing, infrastructure, redevelopment, and tax reform at the same time. They need a way to separate fiscally productive growth from growth that merely shifts costs onto current residents or future budgets. Fiscal impact analysis provides that discipline. It turns a political argument into a budget question.
Table of Contents
- Introduction What Is Fiscal Impact Analysis
- Why Fiscal Impact Analysis Matters for Governance
- Key Methodologies and Their Applications
- The Fiscal Modeling Workflow Step by Step
- Beyond the Numbers Scenario and Sensitivity Analysis
- Common Pitfalls and How to Validate Your Model
- Example Applying FIA to Land Value Capture
- Frequently Asked Questions
Introduction What Is Fiscal Impact Analysis
A city manager listening to a development pitch usually hears two stories at once. The first is visible. New buildings, new residents, commercial activity, and a stronger tax base. The second is less visible but more consequential for the operating budget. More calls for police and fire service, new road maintenance obligations, utility extensions, and heavier school system demands.
Fiscal impact analysis exists to resolve that tension. It involves a comparison between new public revenues and new public costs to determine whether growth is financially sustainable for a jurisdiction, and it focuses on the projection of direct, current, and public costs and revenues rather than broader economic impact claims, as outlined by the Lincoln Institute's explanation of fiscal impact analysis.1 That distinction is important because governments don't fund services with vague economic optimism. They fund them with actual revenue streams.
The question FIA is really answering
In practice, fiscal impact analysis asks a simple but unforgiving question: after a project is approved, who pays for the added public obligations? If projected revenues exceed projected costs, the impact is positive. If costs outrun revenues, current taxpayers absorb the gap through higher taxes, reduced service quality, or deferred maintenance.
That's why a project can be popular in public discussion and still be fiscally weak. A development may create activity in a general sense while still imposing recurring public costs that exceed the jurisdiction's likely revenue gain.
"Practical rule: If a proposal can't be translated into a revenue line and a cost line, it isn't ready for fiscal decision-making."
Why this matters beyond project review
Good fiscal impact analysis also helps governments separate budget analysis from broader capital attraction goals. Those two conversations overlap, but they aren't the same. A finance office may support investment and still conclude that a particular form of growth creates long-term strain.
That discipline becomes even more important when a jurisdiction is thinking about tax-base design, public investment sequencing, or the relationship between land values and public finance. Those issues sit close to broader questions of capital formation and long-term economic structure, where policy makers need to know not just whether development occurs, but whether public revenues rise in a way that supports durable service delivery.
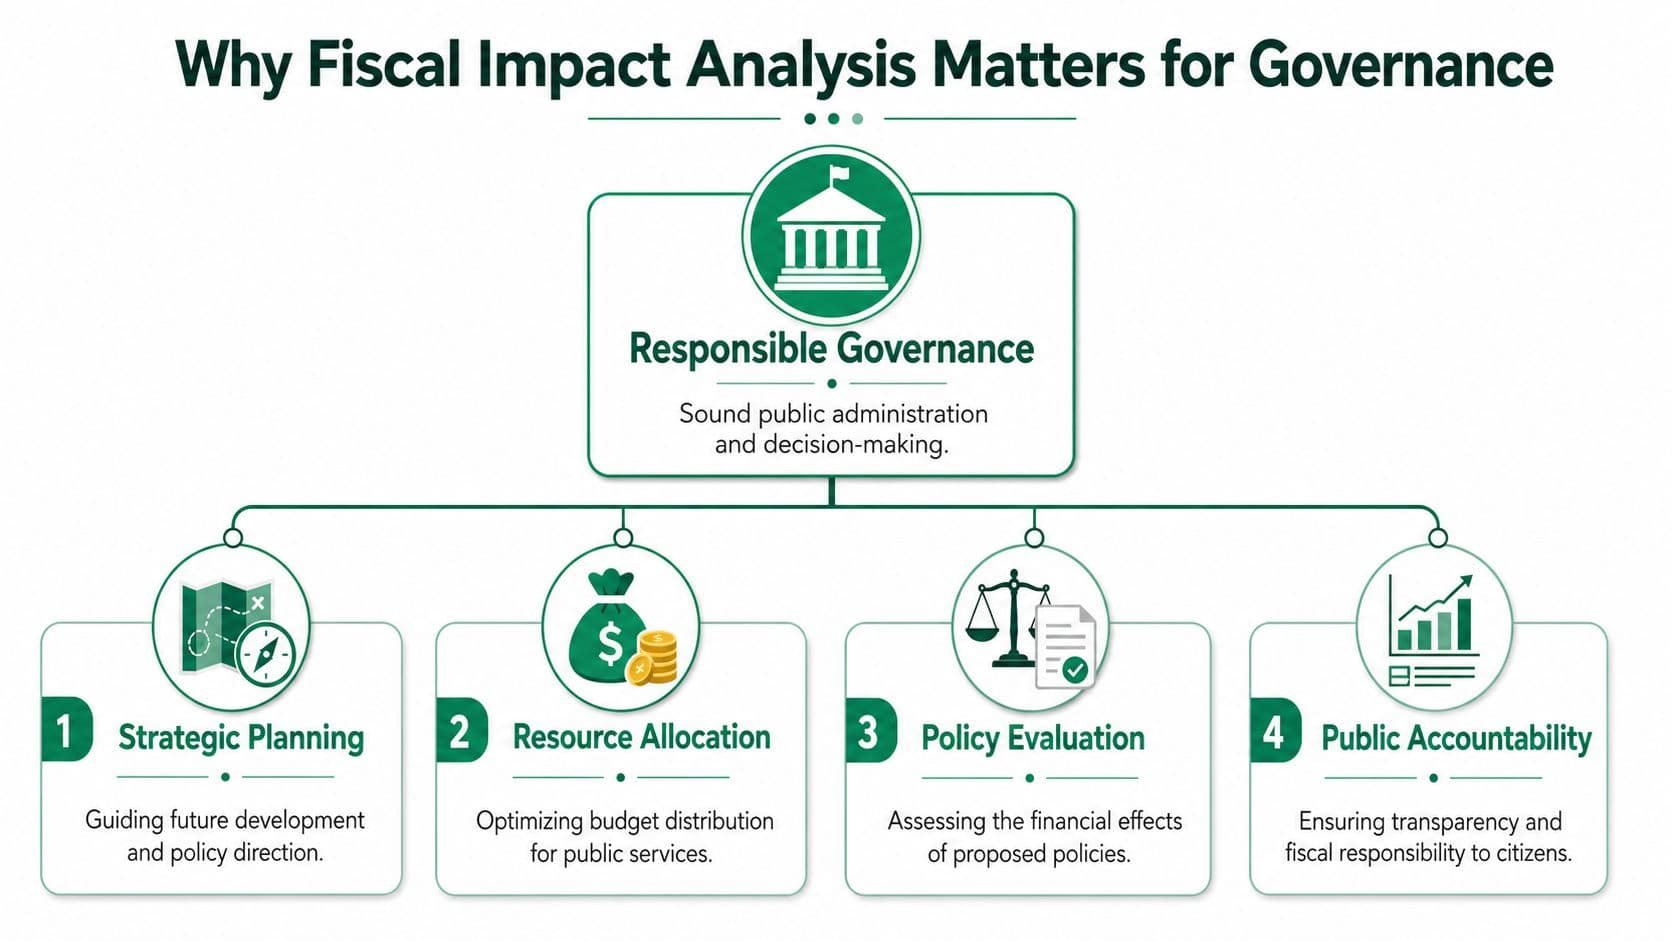
Why Fiscal Impact Analysis Matters for Governance
Local government fails insidiously before it fails visibly. It starts with budgets that look balanced on paper but depend on optimistic assumptions, one-time revenues, or deferred service obligations. Fiscal impact analysis helps prevent that pattern because it forces elected officials and staff to ask whether today's approvals create tomorrow's operating deficit.
A strong analysis also improves the quality of public debate. Instead of arguing in slogans, governments can compare expected revenue flows with expected service demands. That doesn't remove politics from land use decisions, but it changes the standard of proof.
It protects fiscal sustainability
The first governance benefit is straightforward. Fiscal impact analysis shows whether a jurisdiction can meet new service demands without shifting the burden onto existing residents. That's the practical meaning of sustainability in public finance. Growth only helps if the public sector can support it without weakening core services.
This is why FIA shouldn't be treated as anti-development. It is a screen for fiscally durable development. It helps governments favor projects, land uses, and policy structures that strengthen the budget instead of hollowing it out over time.
It strengthens policy credibility
Officials often face pressure to approve projects quickly, particularly when those projects come packaged with claims about revitalization or competitiveness. A credible fiscal model gives administrators and elected leaders a defensible basis for saying yes, no, or not yet.
The value here is institutional, not just technical. When decisions rest on explicit assumptions and transparent calculations, governments can explain tradeoffs in plain language. That reduces the risk that fiscal choices look arbitrary or politically selective.
"A jurisdiction that can explain how a project affects revenues and costs is far more credible than one that relies on aspirational talking points."
It clarifies who benefits and who bears the cost
FIA also has an equity function. It reveals whether the gains from a proposal are private while the liabilities are public, or whether the arrangement is balanced. That matters for impact fees, service expansion, infrastructure timing, and tax reform.
Three governance uses stand out:
- Budget discipline: FIA forces decision makers to distinguish one-time construction activity from recurring operating obligations.
- Service alignment: It helps departments test whether staffing, facilities, and infrastructure standards can keep pace with growth.
- Public accountability: It creates a record that residents, oversight bodies, and future administrations can review.
A government that uses fiscal impact analysis well is better positioned to evaluate incentives, phase infrastructure, and match land use approvals to actual service capacity. That's what responsible governance looks like in practice.
Key Methodologies and Their Applications
Not every fiscal impact analysis should be built the same way. The right method depends on the project type, the data available, and the level of precision a decision requires. As summarized in the Lincoln Institute working paper on fiscal impact analysis, the fiscal-impact literature identifies six commonly used methods: Per Capita Multiplier, Case Study, Service Standard, Comparable City, Proportional Valuation, and Employment Anticipation.1
The practical lesson is that method choice shapes the credibility of the answer. A quick screening tool may be perfectly adequate for an early policy discussion. The same tool may be too crude for a major annexation, tax incentive package, or district-wide reform.
Six methods with different strengths
The Per Capita Multiplier method is the fastest starting point. It estimates costs by applying average public cost per resident to projected population change. It works best when a jurisdiction needs a rough screening analysis and has decent budget data but limited time.
The Case Study method relies on evidence from similar developments. That makes it useful when staff can identify comparable projects and trace their actual fiscal effects. The weakness is obvious. If the comparison isn't similar, the model can mislead.
The Service Standard method is often stronger for operational planning. It estimates costs based on service ratios, such as staffing or facility requirements linked to growth. This is often the right choice when police, fire, utilities, or schools are expected to face clear service expansion triggers.
The Comparable City method uses data from similar municipalities. It can help when local historical data is thin, especially in smaller jurisdictions. But similarity must be tested carefully. Shared population size doesn't guarantee similar service structures, tax systems, or development patterns.
The Proportional Valuation method estimates impacts using property value relationships. It is useful when demographic data is limited but assessed value data is available. This method often appears in early-stage analysis of commercial or mixed-use proposals where property values are more accessible than detailed occupancy profiles.
The Employment Anticipation method is especially relevant for commercial and industrial development because it anchors estimates to jobs and associated service implications. It can be helpful when the policy question centers on business activity rather than household formation.
"Method selection is a policy choice, not just a technical one. The simpler the method, the more cautious the conclusion should be."
A useful way to think about these methods is to match them to the question in front of you. Quick screening, service planning, comparable benchmarking, and commercial forecasting are not the same analytical task. Staff who understand financial analyst roles and responsibilities will recognize this immediately. Good analysis starts by choosing a method that fits the decision.
Comparison of Fiscal Impact Analysis Methodologies
| Methodology | Core Principle | Best Use Case | Data Needs |
|---|---|---|---|
| Per Capita Multiplier | Applies average public cost per person to projected growth | Early screening of residential growth | Budget totals, population assumptions |
| Case Study | Uses evidence from similar past developments | Site-specific review when comparable projects exist | Comparable project records, local fiscal outcomes |
| Service Standard | Estimates cost from service ratios and required capacity | Detailed review of police, fire, schools, utilities, roads | Department service standards, growth forecasts |
| Comparable City | Benchmarks against fiscally similar jurisdictions | Limited local history, especially smaller municipalities | Peer city fiscal data and contextual matching |
| Proportional Valuation | Uses property value relationships to infer costs and revenues | Commercial or mixed-use review with thin demographic data | Property valuation data, tax structure information |
| Employment Anticipation | Connects jobs and associated activity to fiscal effects | Office, industrial, research, and employment-led development | Employment projections, local revenue and service assumptions |
The land-use implications are not neutral. Fiscal-impact research consistently finds that the balance of public costs and revenues varies sharply by land use, with some non-residential and higher-density uses tending to generate net fiscal gains while certain lower-density residential development can impose net fiscal burdens on local government and school budgets.1 That doesn't tell a government what to approve in every case. It does show why fiscal impact analysis belongs alongside broader discussions of ecosystem service valuation and land use tradeoffs, especially when the jurisdiction is weighing public cost, private use, and long-run land strategy together.
The Fiscal Modeling Workflow Step by Step
Good fiscal models rarely fail because of arithmetic. They fail because the scope was vague, the inputs were inconsistent, or the analyst mixed operating and capital assumptions without making the distinction explicit. A disciplined workflow prevents that.
One technical rule should stay front and center. A rigorous fiscal impact analysis compares the stream of future government revenues with the stream of future government costs over the life of the project, spanning both construction and post-construction phases; those revenues and costs can include sales, property, and business taxes, along with infrastructure, utility, and K-12 education expenses.
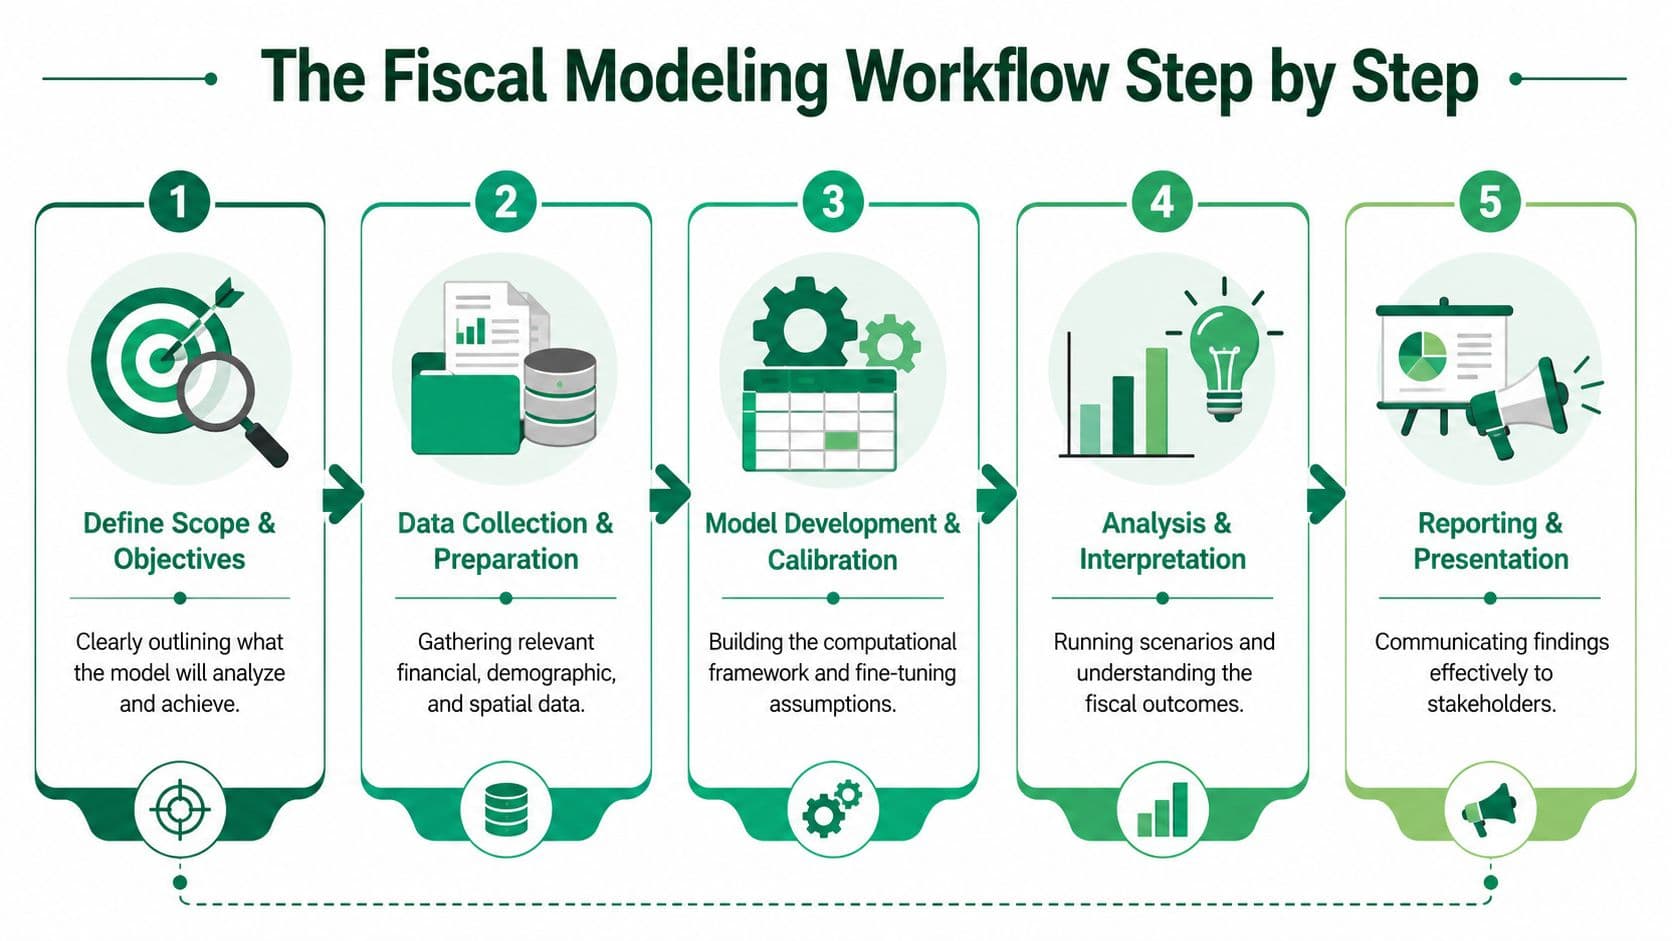
Start with scope before touching spreadsheets
Every model begins with boundary setting. Define the jurisdiction. Define the project. Define the timeline. Clarify whether the question is about a site approval, a district plan, an incentive, or a tax policy change.
Then decide what counts as in scope. Some analyses need only direct governmental revenues and costs. Others also need phase-by-phase treatment of construction-period obligations and post-occupancy service impacts. If that line isn't fixed early, the model won't be internally consistent.
A reliable scoping checklist usually includes:
- Jurisdictional boundary: city, county, school district, or a combination.
- Time horizon: near-term approval effects, long-term buildout, or full lifecycle.
- Decision trigger: rezoning, subsidy, capital investment, annexation, or tax reform.
- Fiscal units: operating budget, capital budget, or both.
Build revenues and costs on separate tracks
Once the scope is fixed, build the revenue side and cost side independently before netting them together. Analysts often create avoidable errors when they jump too quickly to the final balance.
On the revenue side, common categories include property-related revenues, sales-related revenues, and business-related revenues, depending on the jurisdiction's tax structure. On the cost side, the model should account for infrastructure obligations, utility extensions, public safety demand, parks or recreation pressures, and school-related impacts where relevant.
K-12 education often dominates local expenditure pressure, so it shouldn't be buried inside a generic service line. If the project has a significant residential component, that assumption deserves explicit treatment.
"Decision test: If a major cost category is hidden in a catch-all line item, the model isn't ready for policy use."
This is also the point where reform debates enter the picture. A jurisdiction reviewing changes in tax incidence, service burden, or assessment practice should connect project-level analysis with broader questions of property tax reform and tax-base design.
Convert projections into a decision document
The final step is not "produce a number." It's produce a result that a budget officer, elected official, and member of the public can all interpret. That means stating assumptions clearly, distinguishing one-time from recurring effects, and reporting present-value results in a way that shows timing as well as magnitude.
A defensible workflow usually ends with five outputs:
- Assumptions register: the occupancy, valuation, timing, and service assumptions that drive the model.
- Revenue schedule: when revenue begins, how it matures, and which sources are recurring.
- Cost schedule: capital obligations, operating expansion, and department-specific drivers.
- Net fiscal result: the balance after revenues and costs are brought into present value terms.
- Decision notes: the practical implications for phasing, conditions of approval, or policy redesign.
The model is only useful if the decision maker can see where risk sits and what assumptions would change the conclusion.
Beyond the Numbers Scenario and Sensitivity Analysis
A single fiscal impact estimate creates a false sense of precision. It tells you what happens if the world behaves exactly as assumed. Public finance rarely gets that luxury.
Scenario analysis is what turns a static projection into a decision tool. Instead of asking whether one modeled future is favorable, policy makers ask whether the result remains acceptable across a range of plausible conditions. That shift is small in method and enormous in consequence.
A single forecast hides policy risk
Most fiscal models depend on assumptions about buildout timing, occupancy, assessed value growth, service take-up, infrastructure timing, and operational demand. A report that presents one net figure without testing those assumptions is not giving you certainty. It is compressing uncertainty into one line.
Some proposals are fiscally sound, while others are fragile. A sound proposal remains fiscally workable even if assumptions soften. A fragile one only works under ideal conditions. Those are very different policy positions, even when the base-case numbers look similar.
Test the assumptions that drive the result
Sensitivity analysis asks which assumptions matter most. Scenario analysis asks what happens when several assumptions move together. Used together, they help a government identify fiscal exposure before approval rather than after.
A practical framework usually includes three scenarios:
- Most likely case: Uses the best-supported assumptions drawn from current local conditions.
- Conservative case: Tests weaker occupancy, slower valuation growth, delayed revenue realization, or earlier service demands.
- Stress case: Examines conditions where multiple downside risks arrive together.
The point isn't to predict the future perfectly. It's to identify the threshold at which a project or reform changes from surplus to deficit, or from manageable to unstable.
"The net fiscal number should be treated as the beginning of the conversation, not the end of it."
Sensitivity work is especially useful when one variable dominates the result. If a project is positive only because of an aggressive assessed-value assumption, that should change how officials negotiate conditions, reserve requirements, or phasing. Likewise, if school impacts or utility costs are driving the downside, those categories deserve deeper validation before any final vote.
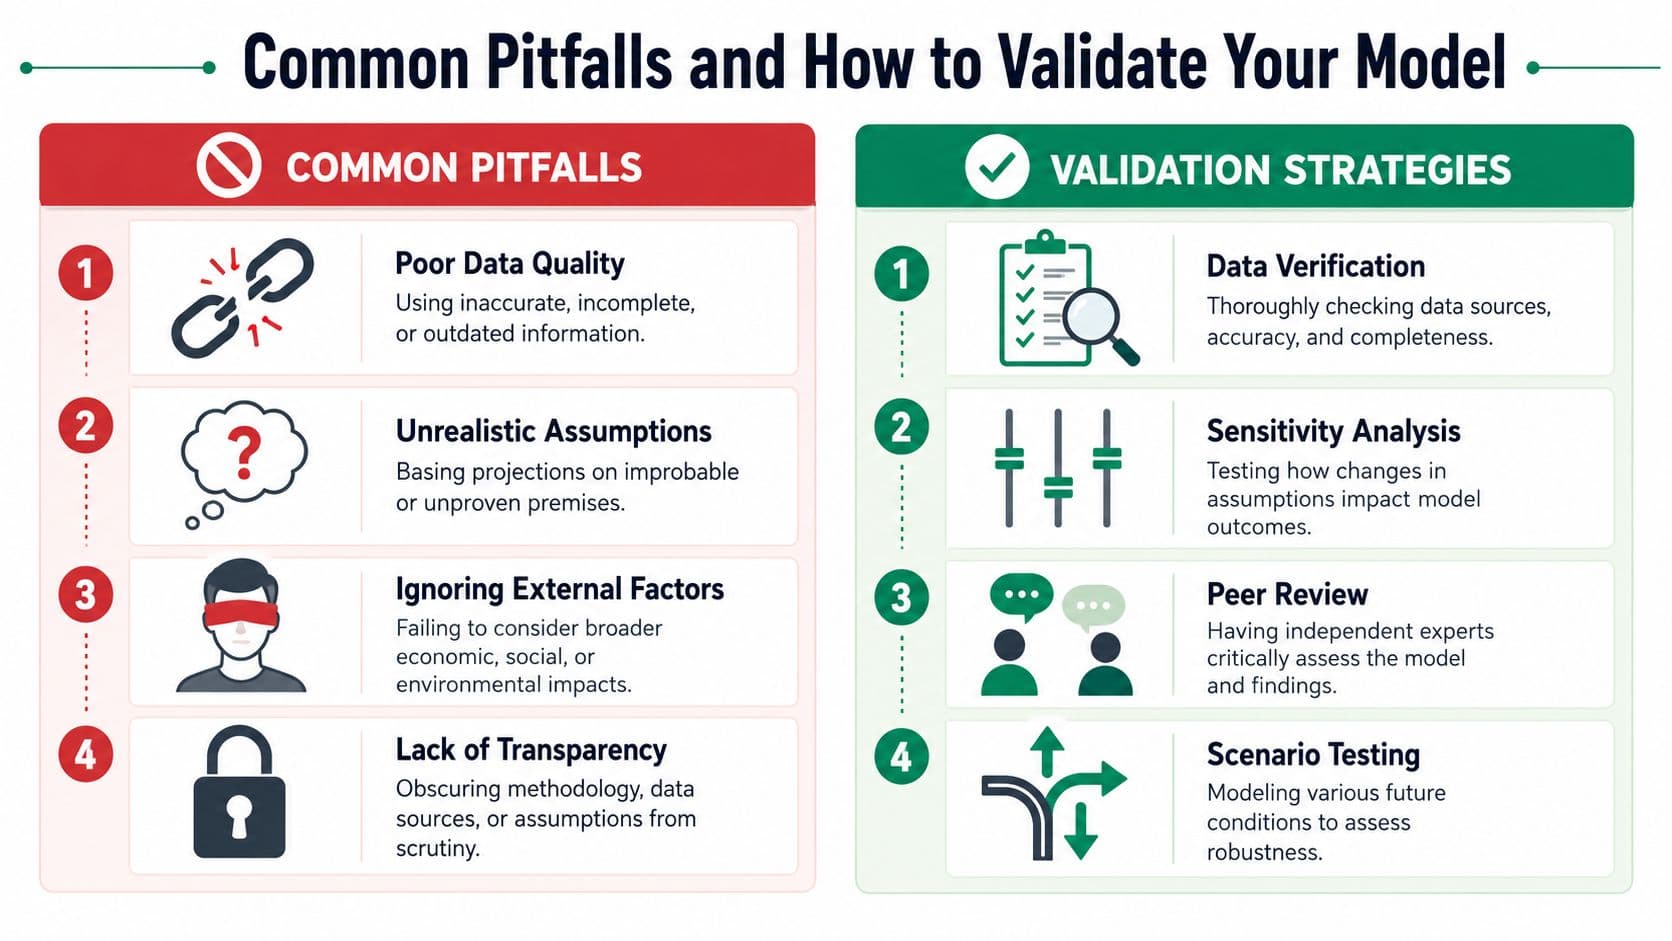
Common Pitfalls and How to Validate Your Model
Most weak fiscal impact analyses look polished. They have tables, appendices, and precise-looking outputs. The underlying problem is usually simpler. Bad data went in, unrealistic assumptions went unchallenged, or a structurally important risk was left out altogether.
The most serious omission in standard practice is the treatment of land markets. Conventional handbooks are built for relatively static projection. They usually don't handle the fiscal instability that can arise when land prices swing sharply and speculative holding distorts both revenue expectations and service planning.
Where standard models go wrong
The routine errors are familiar.
- Outdated cost assumptions: Department cost figures may reflect past budgets rather than current service realities.
- Mixed cost categories: One-time infrastructure obligations get blended with recurring operating costs.
- Opaque assumptions: Reviewers can't tell which variables drive the result.
- Weak comparables: "Similar" projects or jurisdictions are used without testing whether they are fiscally comparable.
Then there's the larger blind spot. Land prices are closely tied to local fiscal sustainability, yet mainstream FIA frameworks still lack dynamic modeling tools that capture how sharp land-price swings feed through to municipal revenues and service planning, as material in Placer County's economic and fiscal impact analysis chapter illustrates in its detailed treatment of land-cost assumptions. That is not a minor technicality. It means a model can appear sound while missing one of the forces most likely to destabilize the tax base.
Speculative land holding can delay productive development, inflate acquisition assumptions, distort assessed values, and create a mismatch between expected public revenue and actual delivery. Static models often treat these pressures as background noise when they should be part of the fiscal core.
How to validate before decisions are locked in
Validation starts with transparency. If reviewers can't reconstruct the model logic, they can't assess whether the conclusion is credible. That's why a validation process should combine financial review, departmental review, and independent challenge.
Useful validation practices include:
- Reconcile to adopted budgets: Tie service-cost assumptions back to actual departmental spending structures.
- Separate recurring from nonrecurring items: Show clearly which costs occur once and which remain in the operating budget.
- Run challenge scenarios: Test slower land absorption, delayed buildout, and higher service demand.
- Document data controls: Treat source checking as part of the analytical method, not an afterthought.
For teams refining internal review standards, a practical primer on understanding data validation importance can help formalize how assumptions, source files, and outputs are checked before they reach decision makers.
The broader policy issue is harder. If a jurisdiction wants a model that reflects real fiscal exposure, it must ask how land incentives shape the timing and pattern of development. That means bringing issues like rent seeking in economics and land-driven distortions into fiscal review instead of treating them as abstract theory. Once you do that, standard FIA starts to look less like a complete answer and more like a necessary base layer.
Example Applying FIA to Land Value Capture
A project-level fiscal impact analysis asks whether one proposal pays its way. A policy-level fiscal impact analysis can ask a deeper question: what happens if the tax system itself changes the behavior of landowners, developers, and the public balance sheet? That is where land value capture becomes analytically interesting.
Consider a city exploring a reform that reduces taxes on buildings or productive activity while increasing the public recovery of land value. The point of the model isn't only to estimate revenue. It is to test whether the reform changes land use patterns, reduces speculative holding, and produces a more stable fiscal base.
How the policy question changes
Under a conventional property tax structure, the model often centers on improvements, transactions, and projected development output. Under a land value capture framework, the model shifts toward site values, holding incentives, redevelopment timing, and the distribution of tax burdens across landowners, homeowners, and businesses. Split-rate approaches that value and tax land and buildings separately are described by international tax-policy guidance as a way to discourage speculative holding and encourage construction.2
That change matters because it speaks directly to the blind spot discussed above. If land speculation is a source of fiscal instability, then a reform that changes the carrying cost of underused land should be tested not just as a tax measure, but as a fiscal stabilization measure. Classic analysis of land taxation supports this logic: a tax on pure land rent tends to fall on landowners and can lower land prices rather than being passed on to tenants.3
A serious model would likely draw on parcel-level valuation work and mapping techniques. Teams working on urban tax reform often benefit from tools associated with leveraging location intelligence in real estate analysis, because the relevant question is spatial as well as fiscal. Which sites are underused, where are service networks already in place, and how does land value vary with access, infrastructure, and public investment?
What a strong model would examine
A useful FIA for land value capture would compare the current tax structure with the reformed structure across several dimensions:
- Revenue composition: Whether the city becomes less dependent on taxes that discourage construction or productive investment.
- Land use response: Whether underused sites are more likely to move toward active use.
- Service efficiency: Whether development shifts toward locations where infrastructure already exists.
- Distributional impact: Which owners pay more, which pay less, and how burdens change across neighborhoods or property types.
There is empirical support for the land-use response the model would test. Studies of Pittsburgh's shift toward taxing land more heavily than buildings find it was associated with a downtown building boom, and evidence from Pennsylvania's two-rate jurisdictions indicates that higher land-value taxes tend to stimulate construction activity and can raise density while curbing sprawl.456
It would also need to test how reform affects the tax base under different market conditions. That's where the analysis improves on standard static FIA. Instead of assuming land price conditions away, it treats land market behavior as part of the fiscal mechanism.
For jurisdictions considering this kind of reform, the technical foundation usually begins with parcel-level work to calculate land value and separate site value from improvements. Advances in data and machine learning now make it feasible to estimate parcel-level land values separately from improvements across residential, commercial, industrial, and agricultural uses.7 Without that step, fiscal modeling stays too aggregated to show who is exposed, who benefits, and how policy changes incentive structures at the ground level.
The strategic payoff is larger than a cleaner spreadsheet. A well-built model can show whether tax policy is reinforcing speculation and underuse, or encouraging development patterns that strengthen municipal finance over time.
If your government is evaluating land-value reform, tax-base redesign, or the fiscal risks hidden inside conventional development models, Unitism® provides research, valuation frameworks, policy design, and fiscal modeling support designed for public decision-makers. Their work helps ministries, cities, and agencies test how land-based revenue systems affect housing, speculation, and long-term fiscal stability before policy is locked in.
Frequently Asked Questions
What is the difference between fiscal impact analysis and economic impact analysis? Fiscal impact analysis focuses specifically on the direct revenues and costs that flow to a government's budget as a result of a development or policy change. Economic impact analysis is a broader exercise that looks at ripple effects across the wider economy, including job creation, income growth, and business activity. Governments often see economic impact figures cited in project proposals, but those numbers don't tell a finance office whether it can pay its bills. Fiscal impact analysis is the tool that answers the budget question directly, and it's the one that should inform approval decisions, incentive negotiations, and service planning.1
How do you choose the right fiscal impact analysis methodology for a given project? The right method depends on three things: the type of development being reviewed, the quality of data available, and how much precision the decision actually requires. A quick per capita multiplier may be perfectly adequate for an early screening of a small residential project, while a major mixed-use development or a tax reform proposal would warrant a more detailed service standard or proportional valuation approach. The key is to match the tool to the decision in front of you rather than defaulting to the most familiar or fastest method. Using a crude method for a high-stakes decision is one of the more common ways fiscal models end up misleading rather than informing.
Why do fiscal impact models sometimes underestimate the true cost of new development? The most common reason is that models rely on average costs rather than marginal costs, which can make growth appear cheaper than it actually is when it triggers new service thresholds. Schools, fire stations, and road capacity don't scale smoothly with population. A development that pushes a department past its service threshold can generate a step-change in public costs that average-based models miss entirely. Beyond that, land market dynamics are rarely built into standard frameworks, so models can look sound on paper while ignoring speculative holding patterns that delay productive use and distort the revenue projections the whole analysis depends on.